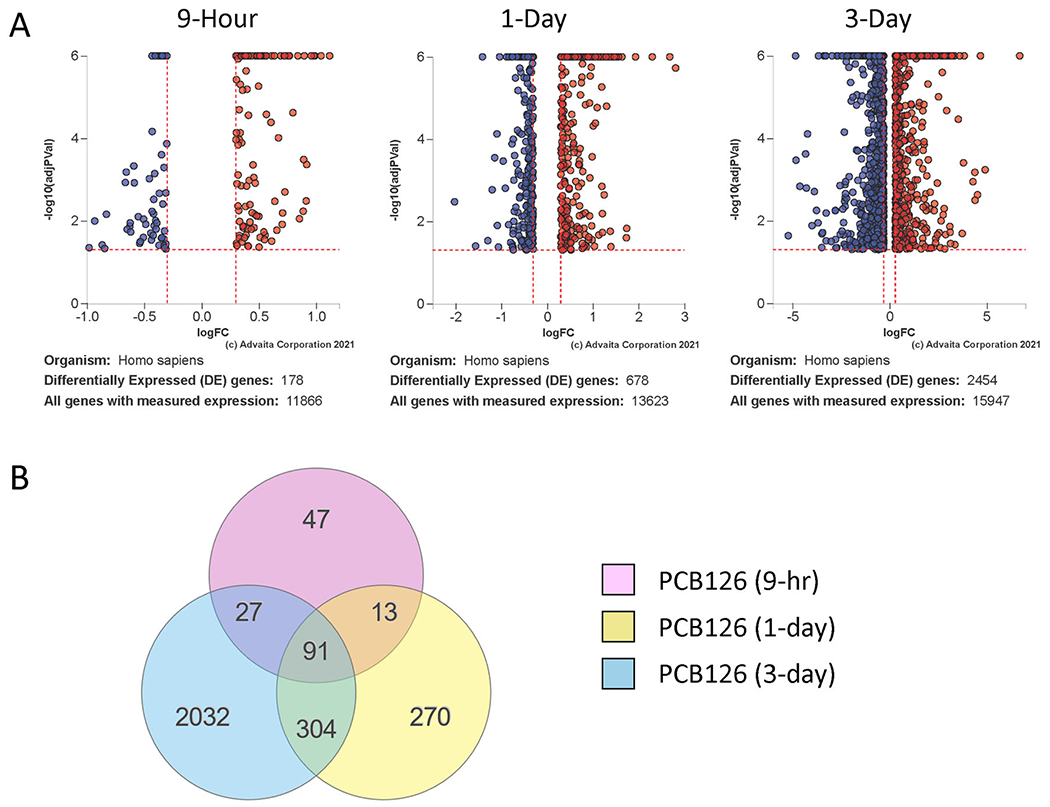
Figure 1:

Transcript changes in PCB126-exposed preadipocytes over a time course. A. Volcano plots showing differentially expressed genes at 9-hour, 1-Day, or 3-Day post-treatment of preadipocytes with PCB126 (10 μM). Red: Upregulated; Blue: Downregulated. DE Thresholds: p-value:0.05; Log2FC: 0.3 B. Venn diagram illustrating overlap of differentially expressed genes at the different timepoints. Fdr≤0.05.
