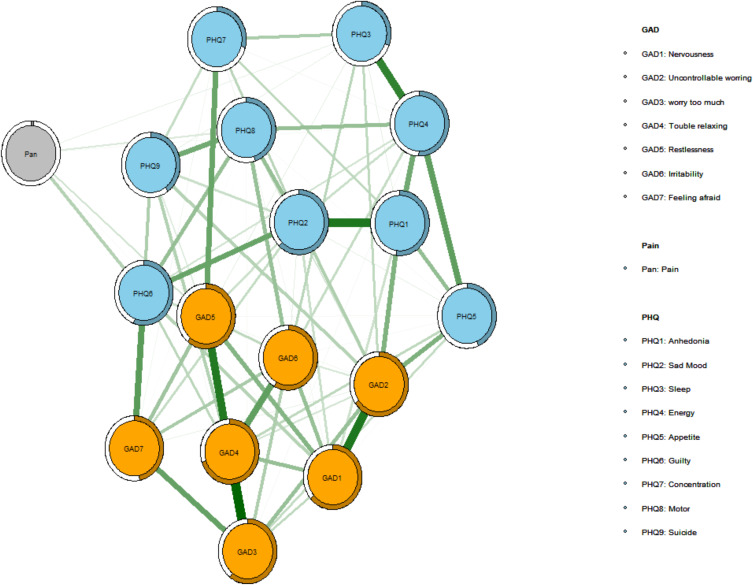
Figure 1.
Network structure of anxiety, pain and depression.
Notes: In the diagram, orange nodes represent anxiety symptoms, light blue nodes represent depression symptoms, and grey node represents pain symptom. Nodes with stronger correlations are closer to each other. The thickness of an edge indicates the strength of the correlation. Green lines represent positive connections.
Abbreviations: PHQ, Patient Health Questionnaire; GAD, General Anxiety Disorder.

