
Figure 3.
mtDNA methylation landscape in the human prefrontal cortex.
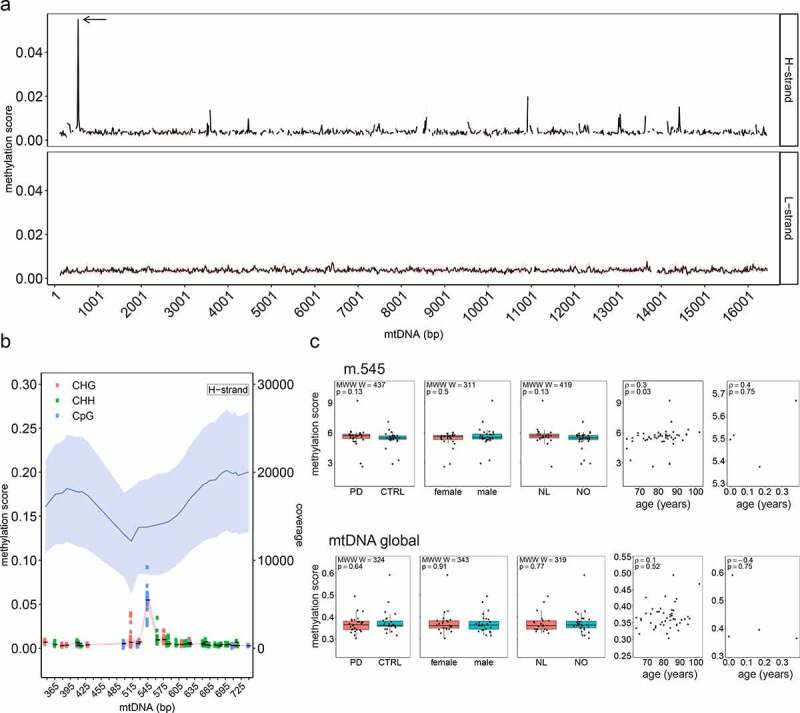
(a) Methylation score of mtDNA for both strands. The black line shows the average methylation score per 15-bp regions for mtDNA positions m.125–16,444. The red band shows the standard deviation. Cytosine mean methylation of 15-bp regions was calculated. The arrow shows the m.545 position. (b) Methylation score and depth of coverage for the mtDNA H-strand surrounding the position m.545 (m.345–745). In the upper part of the plot, mean mtDNA coverage is shown as a blue line and the light blue bands indicate the standard deviation. In the lower part of the plot, the mean methylation for each cytosine is shown as a solid black line with standard deviation indicated by the red band. The genomic context of each cytosine is indicated by different colours. (c) Associations between mtDNA methylation score (global and m.545) and metadata, including disease status (PD vs controls), sex, origin of cohort (Netherlands (NL) or Norway (NO)) and age. The bar plots show no difference between the groups (Mann-Whitney-Wilcoxon test). The scatter plots show a significant correlation between m.545 methylation and age in adult samples (Spearman ρ = 0.3, p = 0.03) while showing no significant correlation between age and the global methylation scores.