Figure 2.

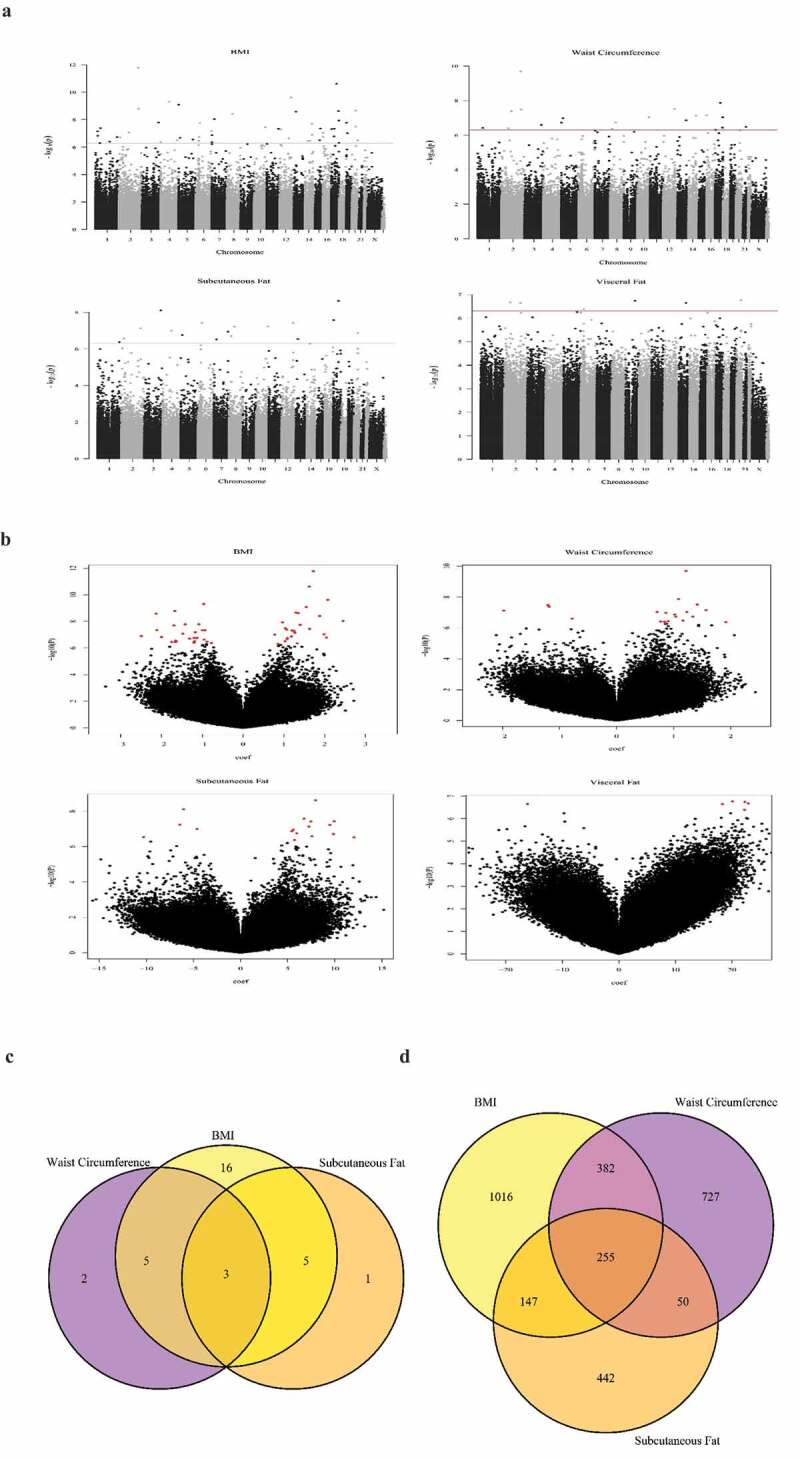
Epigenome Wide Association Study (EWAS) results which show DNA methylation associations with adiposity at 17 years of age.
Figure 2 Manhattan (a) and volcano plots (b) showing the – log10 p-values for individual autosomal CpG probe associations for BMI, WC, subcutaneous and visceral fat thickness. The value of the dotted line in Panel A is the Bonferroni cut-off of P-value = 1.06e-07.(C/D) Venn Diagrams showing overlap between CpGs associated with BMI, WC and subcutaneous fat; C) includes CpGs that are significant after Bonferroni.) includes CpGs that are significant by the threshold p < 0.001. 8 CpGs were shared between BMI and subcutaneous fat thickness, 8 between WC and subcutaneous fat thickness, and 3 (cg21139312 [MSI2], cg07390598 [RAPH1] and cg10773745 [intergenic region]) between all three adiposity measurements
