
Figure 1.
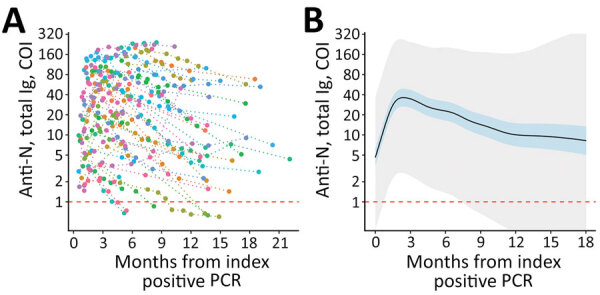
Longitudinal SARS-CoV-2 anti-N total immunoglobulin kinetics among SARS-CoV-2 PCR-positive participants in a study of healthcare workers in Boston, Massachusetts, USA, 2020). A) Individual study participant (n = 74) total anti-N levels from time of index PCR-positive test result. Individual levels are indicated by colored points connected by a dotted line. B) Fitted generalized additive mixed-effect model depicting estimate (solid black line), 95% CI (blue shaded area), and 95% prediction interval (gray shaded area). Estimates are truncated at 18 months given sparsity of later data points. Horizontal dashed red lines indicate the COI for seropositive (above) and seronegative (below) results. The lower limits of detection (COI 0.07) are outside the figure frame. Anti-N, nucleocapsid antibodies; COI, cutoff index.