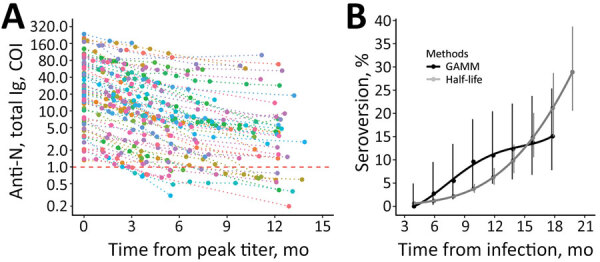
Figure 2.

Longitudinal SARS-CoV-2 total anti-N immunoglobulin contraction and estimated seroreversion over time in a study of healthcare workers in Boston, Massachusetts, USA, 2020. A) Consistency in contraction of individual-level total anti-N immunoglobulin levels over time when indexed against participants’ highest recorded sample value. Includes seropositive participants with and without registered SARS-CoV-2 PCR-positive test results and with >1 sampling time points after peak level (n = 90). Individual levels are indicated by colored points connected by a dotted line. Horizontal dashed red line indicates the cutoff index for seropositive (above) and seronegative (below) results. The lower limit of detection (COI 0.07) is outside the figure frame. B) Points indicating estimated rates of seroreversion from total anti-N immunoglobulin seropositive to seronegative by 2-month intervals. The half-life estimate is based on peak total anti-N immunoglobulin level of 37 COI and half-life of 128 days. Solid lines indicate quadratic polynomial trend; error bars indicate 95% CIs. Anti-N, nucleocapsid antibodies; COI, cutoff index; GAMM, generalized additive mixed-effect model.
