
Figure.
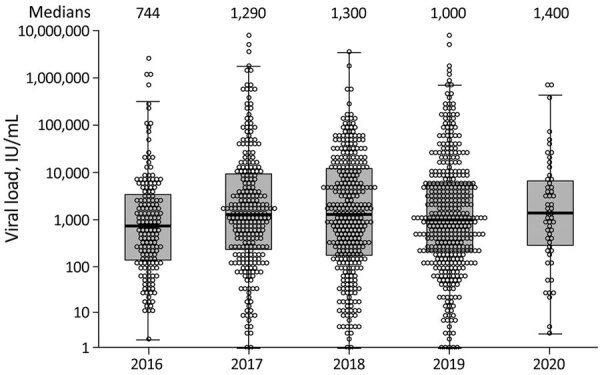
Hepatitis E virus viral loads in 1,200 individual blood donors in England, 2016–2020. Median viral loads were comparable over the study period. Circles indicate individual donors; horizontal lines within boxes and numbers above plots indicate medians; boxes indicate first and third quartile values; whiskers indicate lowest and highest data points.