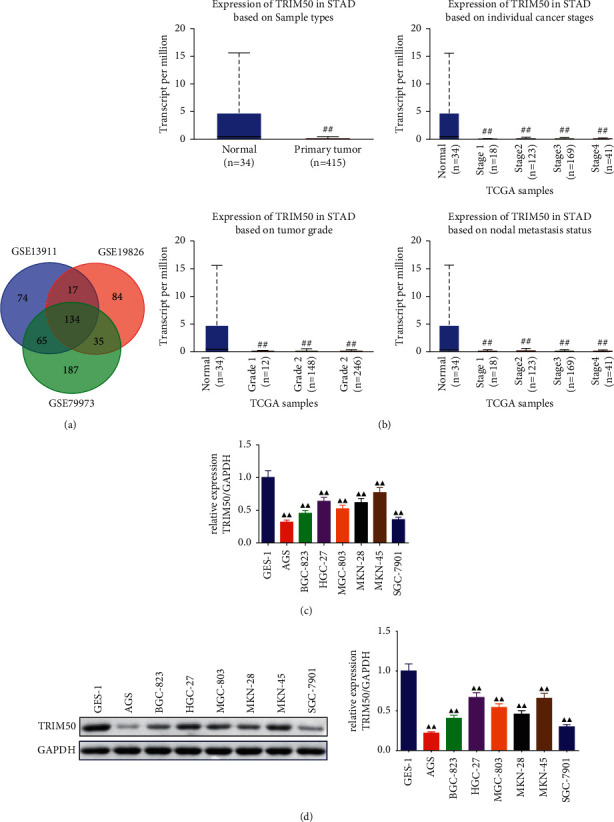
Figure 1.

TRIM50 was expressed at a low level in GC. (a) Venn diagram showed the common genes related to GC among three datasets. (b) TCGA database revealed the relationship between TRIM50 expression and GC development. There were 34 normal samples and 415 primary GC tumor samples used for analysis. TRIM50 mRNA and protein expression of human gastric mucosal epithelial cells and GC cells were evaluated by qPCR (c) and Western blot (d). One-way ANOVA and Tukey tests were applied for multi-group comparison, and two-tailed Student's-test was utilized for intergroup comparisons. #p < 0.05 and ##p < 0.01vs. Normal. ▲p < 0.05 and ▲▲p < 0.01vs. GES-1 group. Results were presented as mean ± SD. n = 3.
