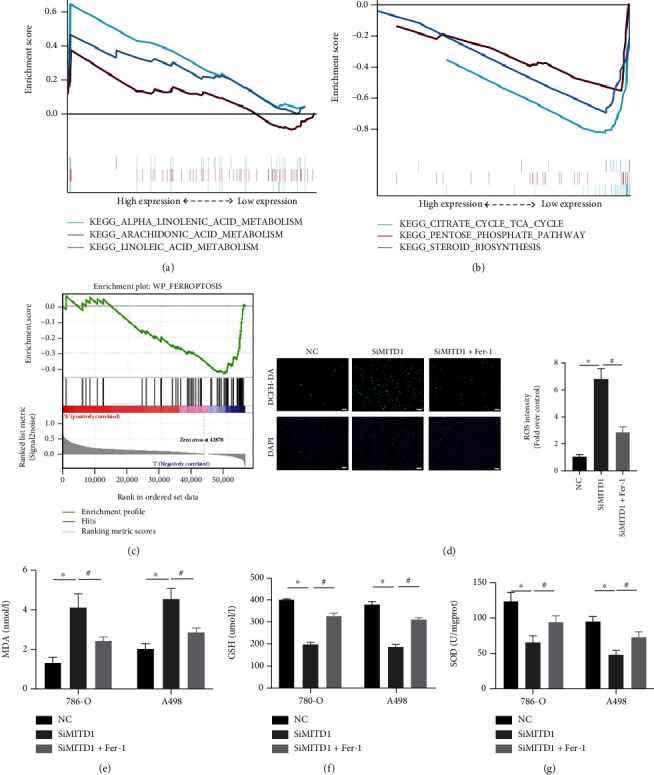
Figure 3.

MITD1 knockdown induces ferroptosis in ccRCC. (a) KEGG pathway showed top three positively correlated groups. (b) KEGG pathway showed top three negatively correlated groups. (c) Results of MITD1 enriching to the ferroptosis pathway through GSEA platform with the WikiPathways. (d) Representative images of 786-O with DCFH-DA staining (magnification ×100; scale bars = 100 μm) and their quantitative analysis. (d–f) Levels of MDA, GSH, and SOD in ccRCC cells with different treatments. Values are expressed as the mean ± SEM, n = 3. ∗P < 0.05, relative to the control group; #P < 0.05, relative to the SiMITD1.
