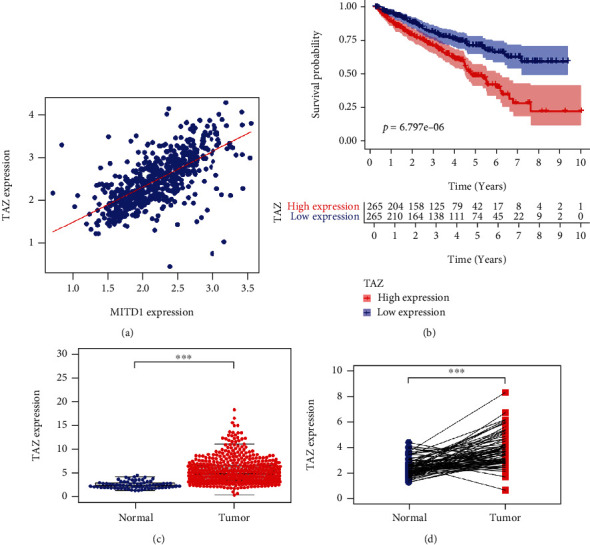
Figure 5.

TAZ was highly correlated with MITD1 and high expressed in ccRRC. (a) A positive correlation between the MITD1 and TAZ expressions through bioinformatics analysis. (b) Based on the median values of TAZ expression, patients were divided into the low-expression or high-expression group. Kaplan-Meier's survival curve of two groups through the analysis of clinical information of ccRCC in TCGA. (c) The expression of TAZ in ccRCC tissues was higher compared to the normal tissues through TCGA dataset analysis. (d) The expression of TAZ in paired ccRCC tissues was also higher compared to the paracancerous tissues. Values are expressed as the mean ± SEM, n = 3. ∗P < 0.05 and ∗∗∗P < 0.001. relative to the control group.
