
Figure 9.
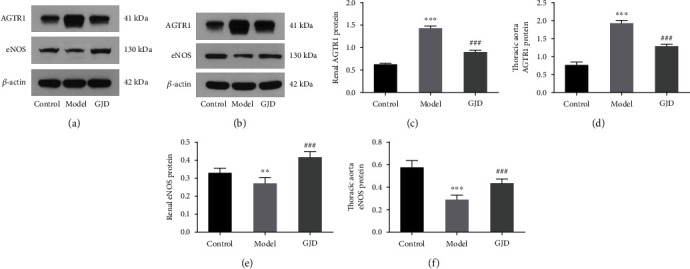
Effects of GJD on the expression of AGTR1 (a–d) and eNOS (a, b, e, and f) protein in the kidney (a) and thoracic aorta (b) of hypertensive rats induced by high-salt based on western blot analysis. ∗P < 0.05, ∗∗P < 0.01, and ∗∗∗P < 0.001 compared with the control group; #P < 0.05, ##P < 0.01, and ###P < 0.001 compared with the model group.