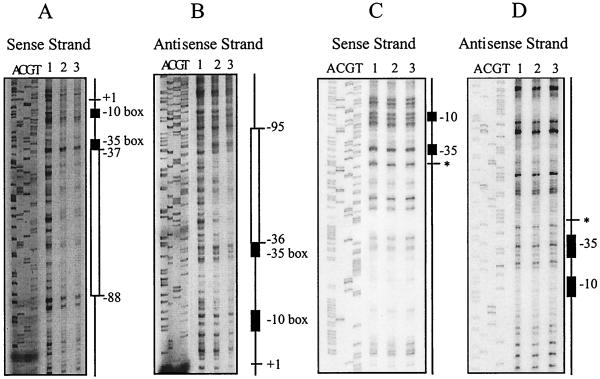
FIG. 5.
DNase I footprinting analysis. Results of footprinting reactions where either the sense or antisense DNA strands were labelled with [γ-32P]ATP are shown. Sequencing reactions with the same oligonucleotide primers used to generate the PCR products are shown next to the footprinting reactions. The −10 and −35 boxes are represented by the black rectangles. (A and B) Identification of the VirR binding site. Regions protected from DNase I digestion are represented by the open rectangles. The transcription start point is shown as +1, and the positions of the regions of protection relative to +1 are as indicated. (C and D) Analysis of the VirR binding site deletion derivative. The site of deletion is indicated by the asterisk. In all panels, lane 1 contains no VirR and lanes 2 and 3 contain 1 and 2 μg of VirR, respectively. All footprinting reaction mixtures contained 25,000 cpm of labelled DNA.

