
Figure 7.
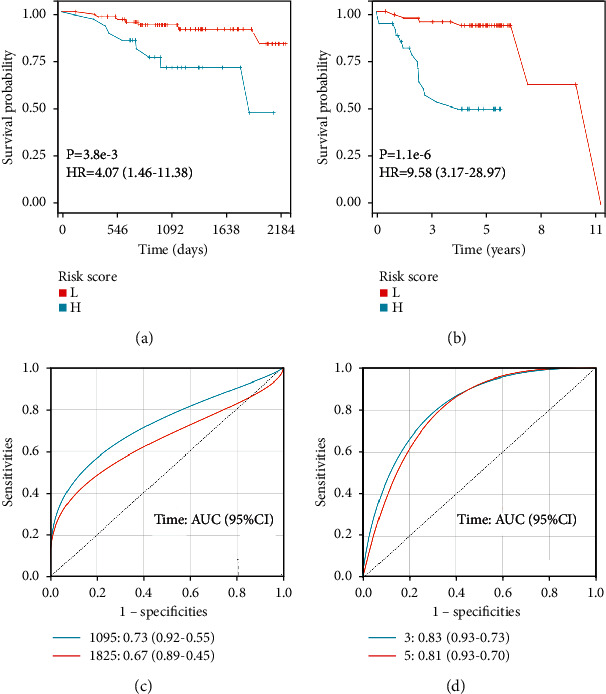
Prognostic evaluation of gene expression signature-based nomogram models in validation cohorts. (a) Kaplan–Meier plotter overall survival curve in GSE16446. (b) Kaplan–Meier plotter progression-free survival curve in GSE45255. (c) Receiver operating characteristic (ROC) analysis of the four-gene signature in GSE16446. (d) ROC analysis of the six-gene signature in GSE45255. Abbreviations: L, low; H, high; HR, hazard ratio.