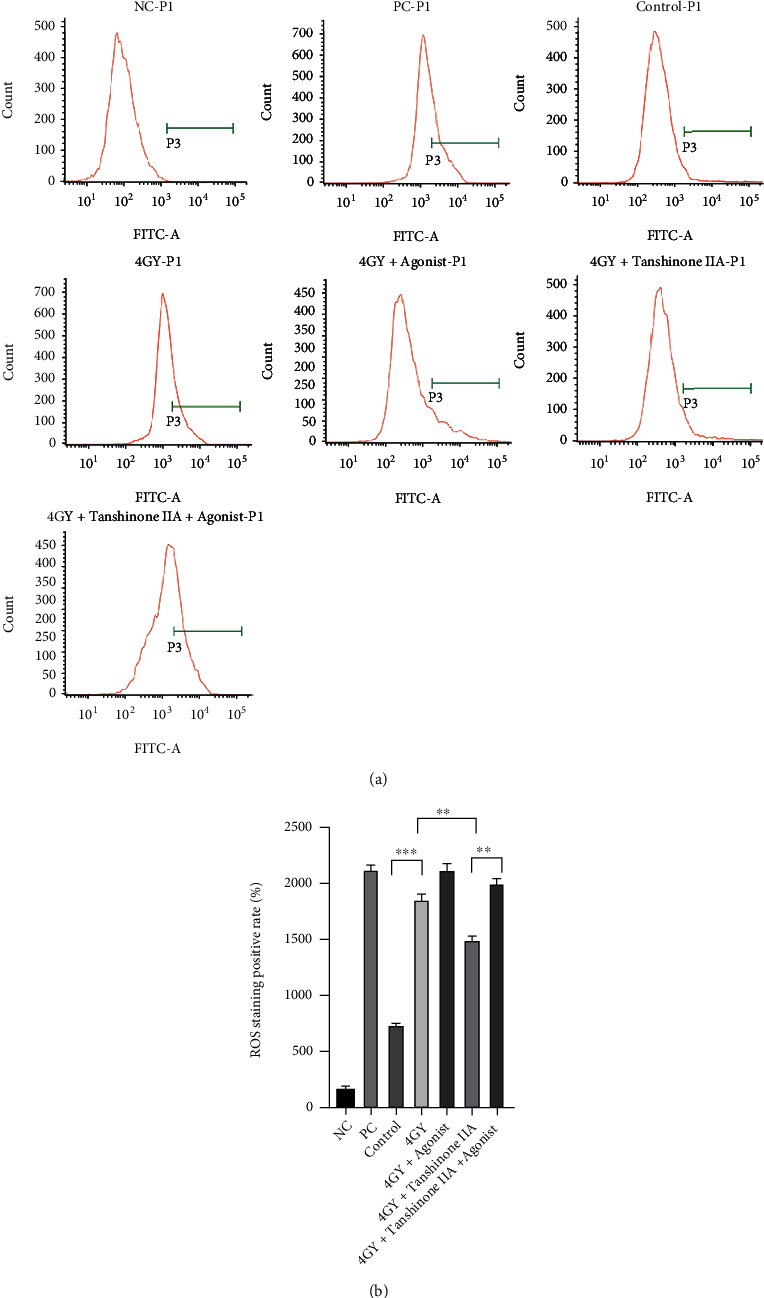
Figure 3.

Effects of radiation and tanshinone IIA on oxidative stress in cardiomyocytes. (a) The ROS profile of each grouped cell was determined by flow cytometry. (b) The positive rates for ROS staining are expressed as mean ± SD. All results are presented as means ± SD (n = 3). ∗∗∗P < 0.001 and ∗∗P < 0.01. ROS: reactive oxygen species; NC: negative control; PC: positive control.
