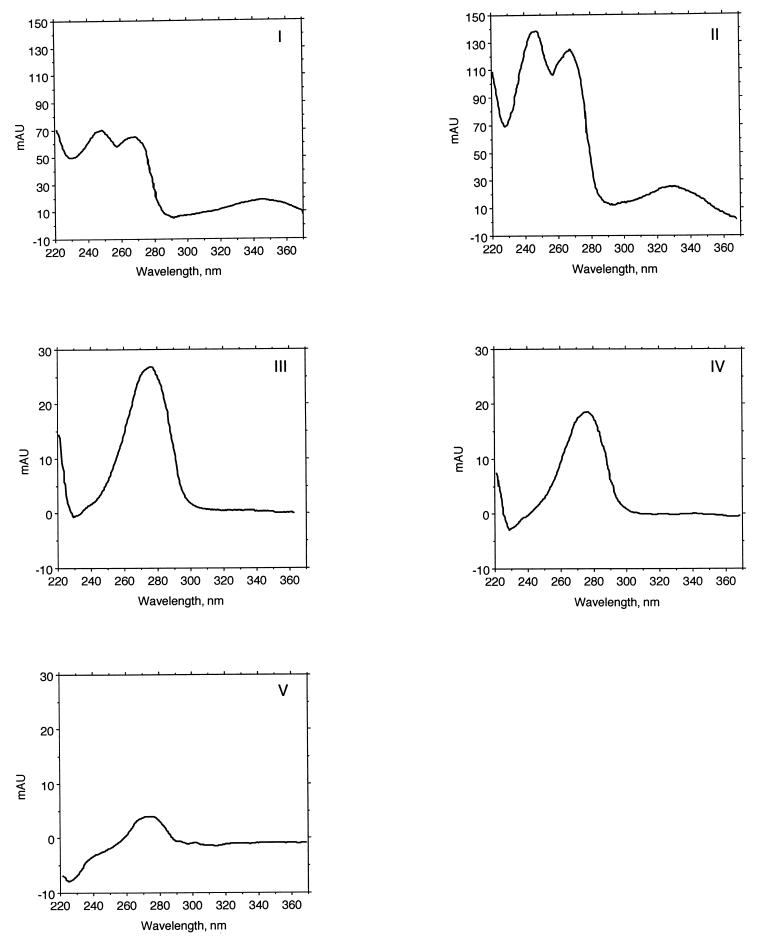
FIG. 4.
UV absorption spectra for quinone peaks. The quinone spots were recovered from the TLC plate (Fig. 3) and were subjected to HPLC analysis with diode array detection. Each quinone eluted as a single peak. The spectra for the quinones in spots I and II are typical menaquinone spectra, with λmax at ∼245, 270, and 330 to 340 nm (42), while those of spots III, IV, and V are consistent with ubiquinones with a λmax of ∼275 nm.

