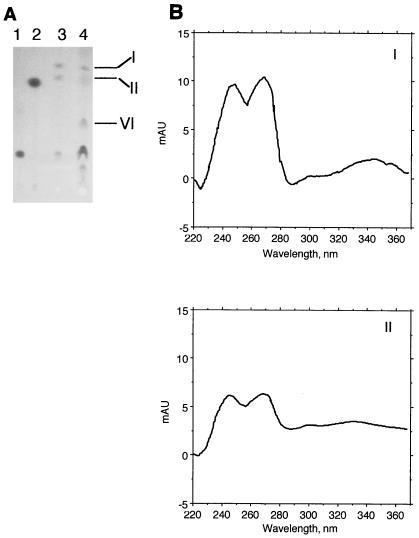
FIG. 5.
(A) Thin-layer chromatogram of quinone standards and of quinones isolated from S. putrefaciens cells grown anaerobically with fumarate as the electron acceptor. Lanes 1 and 2 were loaded with ubiquinone-6 and menaquinone-4 standards, respectively. The other lanes were loaded with quinone extracts isolated from cells of the following strains: lane 3, MR-1 (equivalent to 0.18 g of wet cells); lane 4, MR-1A (equivalent to 0.72 g of wet cells). The samples were loaded at the bottom, and migration was upward. The numbered quinone spots were recovered from the TLC plate and subjected to HPLC analysis using diode array detection. Each quinone eluted as a single predominant peak, and the UV absorption spectra of the quinone peaks from MR-1A are shown (B). The spectra for the quinones in spots I and II are typical menaquinone spectra, with λmax at ∼245, 270, and 330 to 340 nm (42). The spectrum for spot VI (not shown) was consistent with ubiquinone with a single λmax of 275 nm (42).

