Fig. 5.
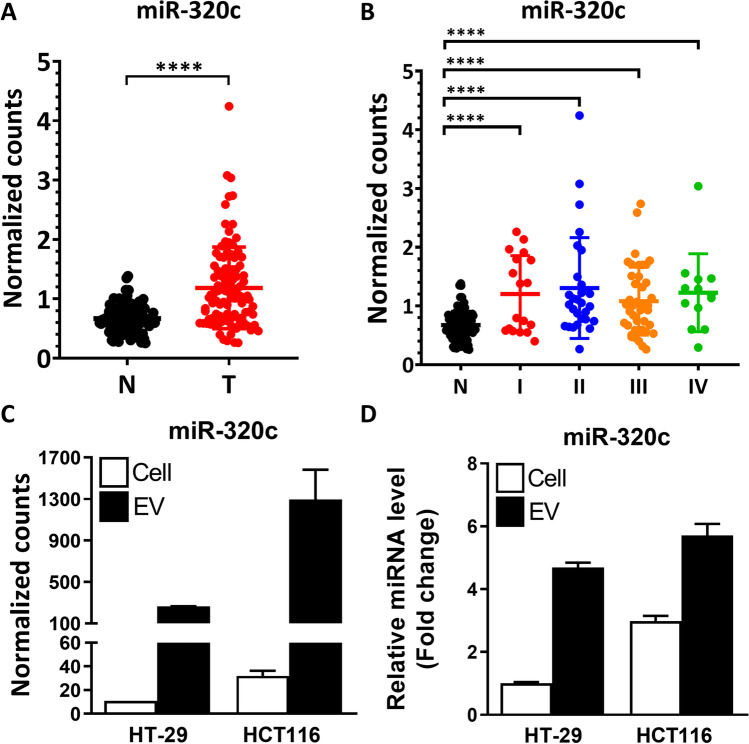
The expression levels of miR-320c in the CRC primary tumor vs. adjacent normal tissues and in cultured CRC cells. (A) Distribution of miR-320c expression levels, based on small RNA-seq data, in the 102 pairs of CRC tumor and adjacent normal tissues. (B) Paired specimens were further grouped into four clinical stages, and miR-320c expression patterns across the different stages of CRC are depicted. (C & D) The expression patterns of miR-320c in the cell extracts (Cell) and EVs isolated from medium, as determined by small RNA-seq (C) and RT-qPCR (D) analyses. Two CRC cell lines, HT-29 and HCT116, were monitored

