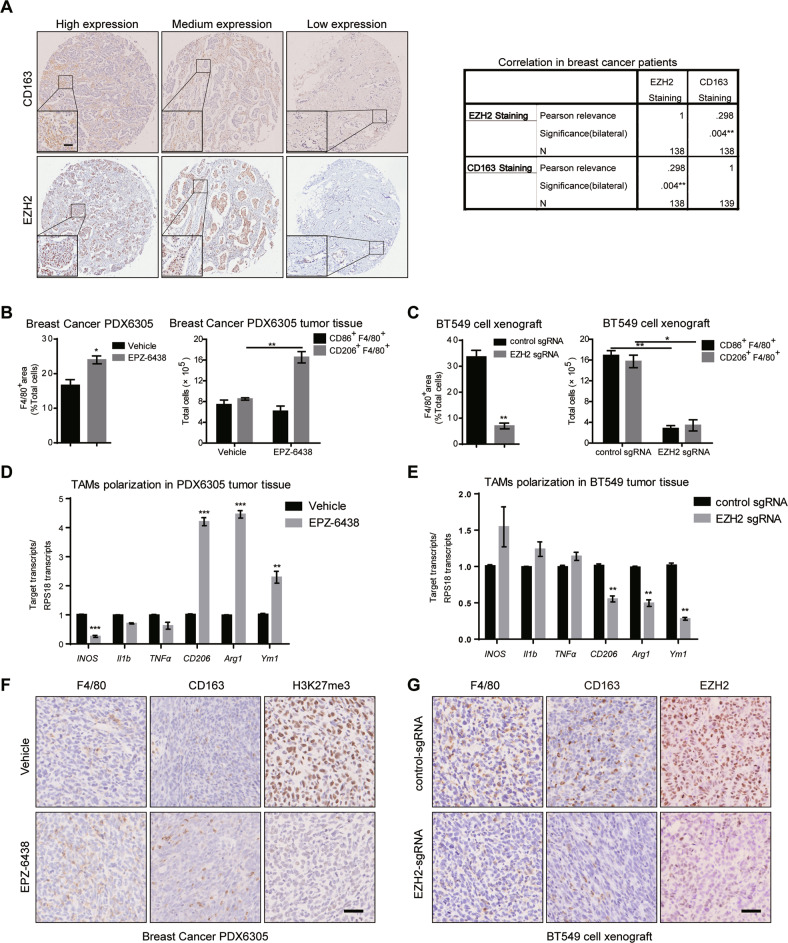
Fig. 1. EZH2 depletion and inhibition differently affects BC cell growth and TAMs polarization.
A Expression and the correlation of CD163 and EZH2 were examined by IHC in breast cancer patients from a tissue microarray (n = 139). Scale bar, 50 μm. The percentage of total macrophages, M1 and M2 macrophages in 200 mg/kg/day EPZ-6438-treated PDX6305 tumor tissues B and BT549 EZH2-knockdown tumor tissues C were analyzed by flow cytometry. RT-qPCR was applied to detect the expressions of M1 markers (iNOS, Il1b, TNFα) and M2 markers (CD206, Arg1, Ym1) in EPZ-6438-treated PDX6305 tumor tissues D or BT549 EZH2-knockdown tumor tissues E. F Immunohistochemistry of F4/80, CD163 and H3K27me3 in tumor tissues treated with or without EPZ-6438. G Immunohistochemistry of F4/80, CD163 and EZH2 in mock and EZH2 knockdown tumor tissues. Scale bar, 50 μm. In B–E, all data were shown as mean values ± SD (n = 3). Statistical significance was addressed using unpaired, two‐tailed Student’s t‐test, *p < 0.05, **p < 0.01, ***p < 0.001, NS, not significant. The statistical significance was calculated compared to the negative control (NC) in each group. The shown were representative of replicates and the experiments were repeated three times.

