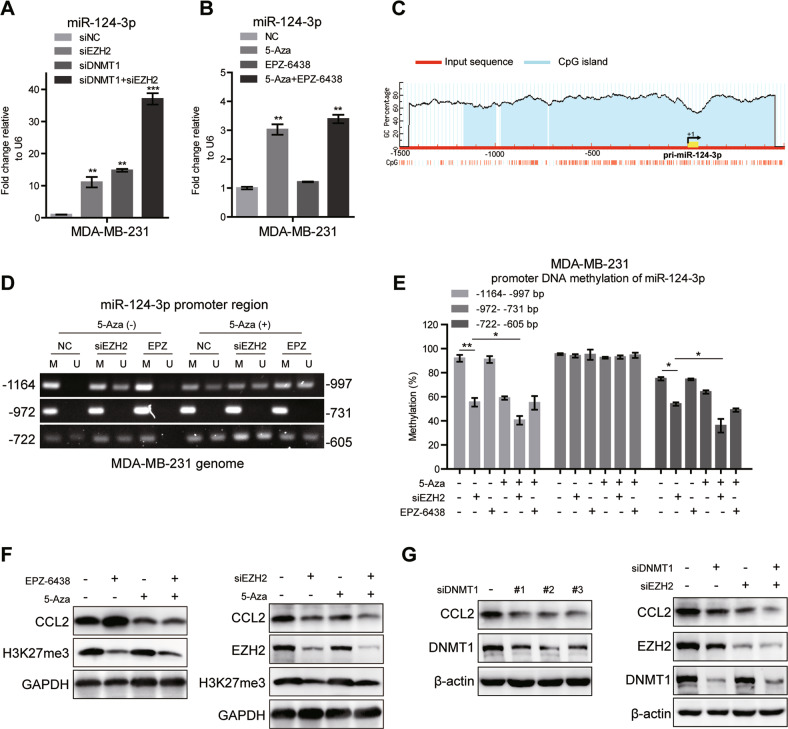
Fig. 5. miR-124-3p is regulated by EZH2 and DNMT1 mediated DNA methylation.
A The miR-124-3p level was analyzed by RT-qPCR in MDA-MB-231 cells treated with EZH2 siRNA or/and DNMT1 siRNA for 48 h. U6 was included as a control. n = 3. B The miR-124-3p level was analyzed in MDA-MB-231 cells treated with 5 μM 5-Aza-CdR (5-Aza) or/and EPZ-6438 for 48 h. U6 was included as a control. n = 3. C Modified output of MethPrimer program (Li and Dahiya, 2002). Coordinates are given in relation to the transcription start site (TSS). A large CpG island (−1200 to +450 bp, blue region) is evident in the upstream of the gene. Vertical lines indicate relative positions of CpG dinucleotides. D 5-Aza-CdR (5-Aza) and EZH2 siRNA treatment decreased the DNA methylation level of miR-124-3p promoter region (−1164 to −997 and −722 to −605bp) in MDA-MB-231 cells analyzed by MSP. The relative percentages of the methylation were quantified due to the PCR results E. F The CCL2 levels were analyzed by western blot in MDA-MB-231 cells treated with 5-Aza and EZH2 siRNA or 5-Aza and EPZ-6438 for 48 h. G The CCL2 levels were analyzed by western blot in MDA-MB-231 cells treated with siDNMT1 and siEZH2 for 48 h. The shown were representative of replicates and the experiments were repeated three times. In (A, B and E), all data were shown as mean values ± SD (n = 3). Statistical significance was addressed using unpaired, two‐tailed Student’s t‐test, *p < 0.05, **p < 0.01, ***p < 0.001, NS not significant. The statistical significance was calculated compared to the negative control (NC) in each group.

