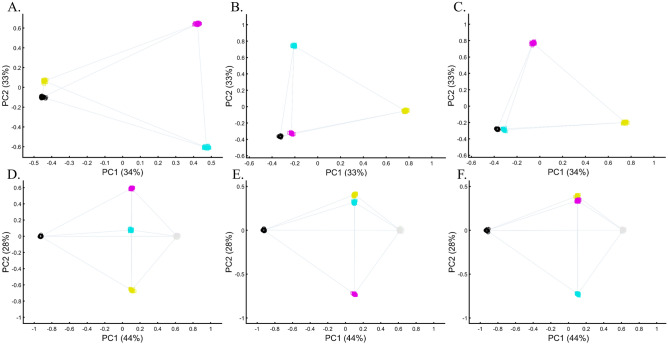
Figure 11.
Studying the effects of minor sample variation on PCA results using color populations (nall = 50). (A–C) Analyzing secondary colors and Black. (D–E) Analyzing secondary colors, White, and Black. Scatter plots show the top two PCs. Colors include Cyan [0,1,1], Purple [1,0,1], Yellow [1,1,0], White [1,1,0], and Black [0,0,0].

