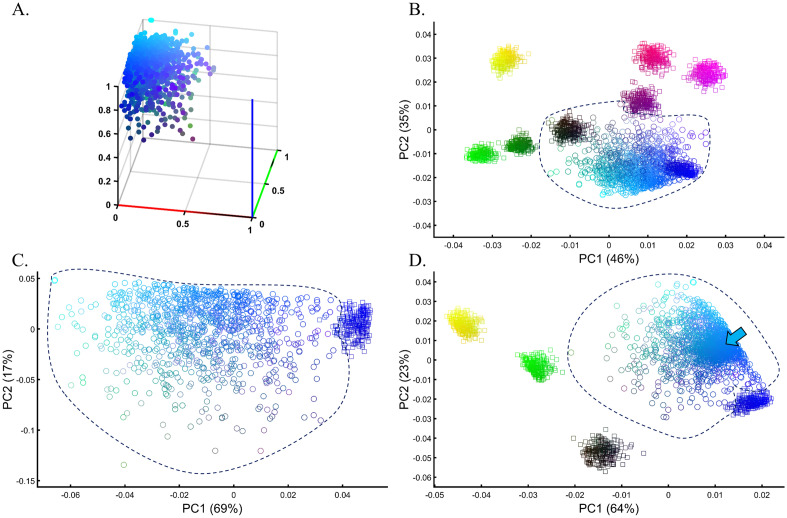
Figure 13.
Evaluating the accuracy of PCA clustering for a heterogeneous test population in a simulation of a GWAS setting. (A) The true distribution of the test Cyan population (n = 1000). (B) PCA of the test population with eight even-sized (n = 250) samples from reference populations. (C) PCA of the test population with Blue from the previous analysis shows a minimal overlap between the cohorts. (D) PCA of the test population with five even-sized (n = 250) samples from reference populations, including Cyan (marked by an arrow). Colors (B) from top to bottom and left to right include: Yellow [1,1,0], light Red [1,0,0.5], Purple [1,0,1], Dark Purple [0.5,0,0.5], Black [0,0,0], dark Green [0,0.5,0], Green [0,1,0], and Blue [1,0,0].

