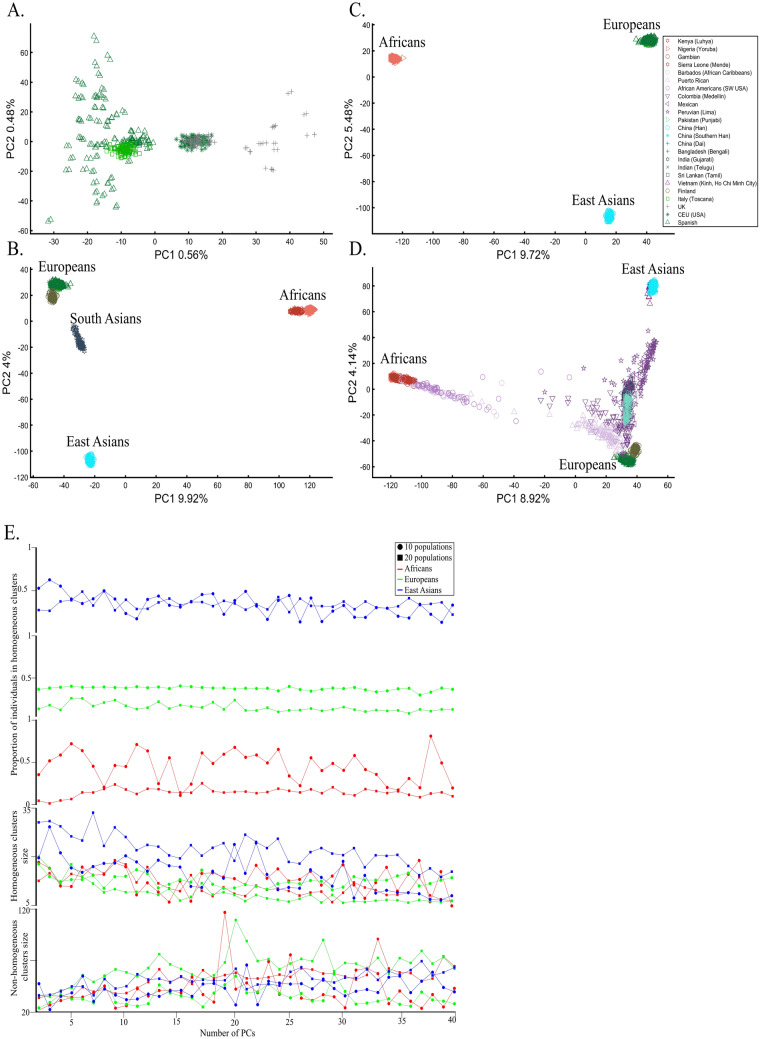
Figure 14.
Evaluating the cluster homogeneity of European samples. PCA was applied to the four European populations (Tuscan Italians [TSI], Northern and Western Europeans from Utah [CEU], British [GBR], and Spanish [IBS]) alone (A), together with an African and Asian population (B), as well as South Asian population (C), and finally with all the 1000 Genomes Populations (D). (E) Evaluating the usefulness of PCA-based clustering. The bottom two plots show the sizes of non-homogeneous and homogeneous clusters, and the top three plots show the proportion of individuals in homogeneous clusters. Each plot shows the results for 10 or 20 random African, European, or Asian populations for the same PCs (x-axis).

