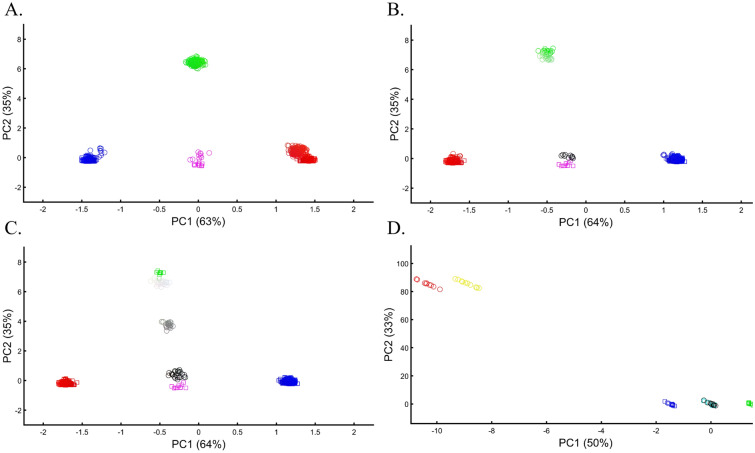
Figure 17.
Examining the accuracy of PCA projections. The PCA results of one dataset (circles) were projected onto another (squares). In (A), testing the case of varying sample sizes between the first (nRed = 200, nGreen = 10, nBlue = 200, nPurple = 10) and second (nRed = 200, nGreen = 200, nBlue = 10, nPurple = 10) datasets, where in the second dataset, colors varied a little (e.g., [1,0,0] → [1,0.1,0.1]). In (B–D), the sample size varied (10 ≤ n ≤ 300) for both datasets. Colors include Red [1,0,0], Green [0,1,0], light Green [1,0.2,1], Cyan [0,1,1], Blue [0,0,1], Purple [1,0,1], Yellow [1,1,0], Grey [0.5,0.5,0.5], White [1,1,1], and Black [0,0,0].

