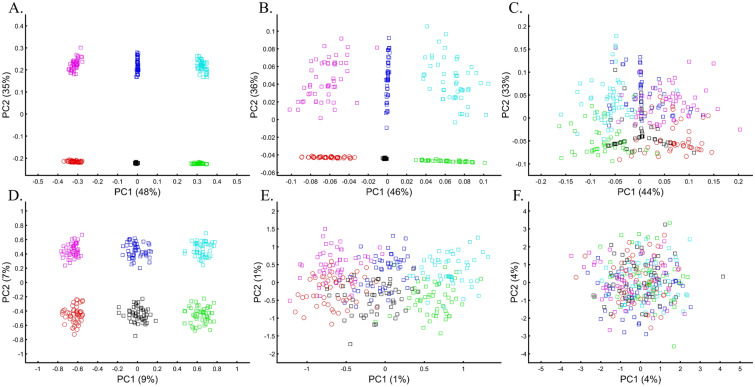
Figure 21.
Testing the effects of missingness and noise in a PCA of six fixed-size (n = 50) samples from color populations. The top plots show the effect of missingness alone or combined with noise: (A) 50% missingness, (B) 90% missingness, and (C) 90% missingness and low-level random noise in all the markers. The bottom plots test the effect of noise when added to the original markers in the above plots using: (D) 30 random markers, (E) 300 random markers, and (F) 3000 random markers. Colors include Red [1,0,0], Green [0,1,0], Blue [0,0,1], Cyan [0,1,1], Yellow [1,1,0], and Black [0,0,0].

