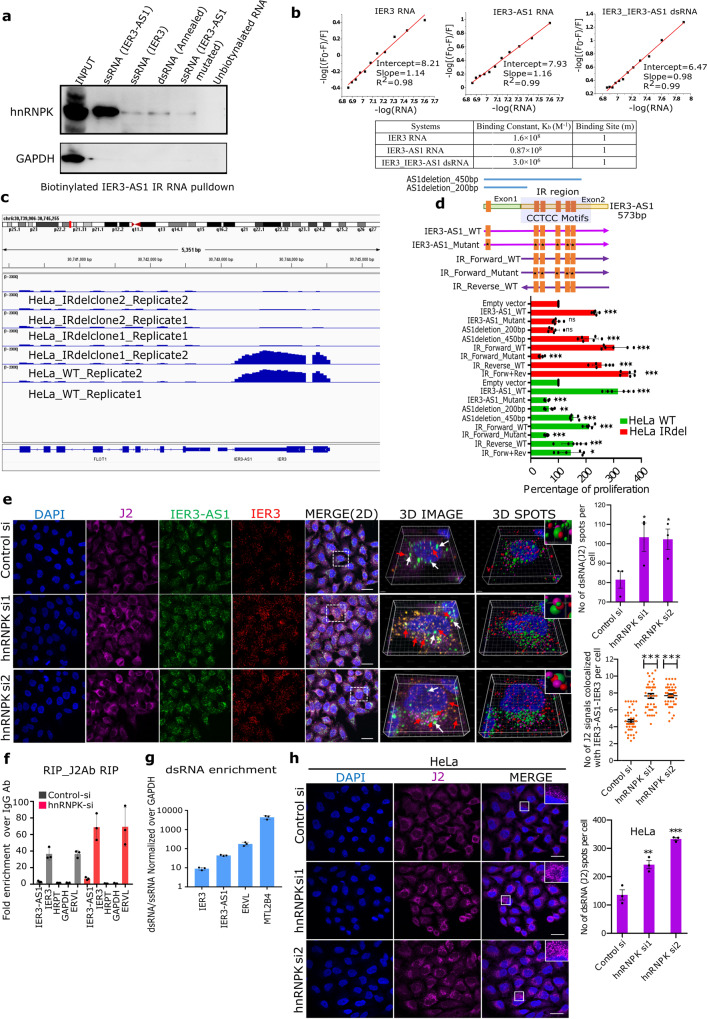
Fig. 5. HnRNPK control global single- and double-strand RNA.
a Biotinylated RNA pulldowns using streptavidin beads followed by western blotting with HnRNPK antibody. GAPDH was used as a control for RNA pulldown specificity. Same results were obtained from independent replicate. b Plots of -log[(F0-F)/F] vs -log[RNA] for the equilibria between IER3, IER3-AS1 and duplex RNA IER3/IER3-AS1 showing the Intercept values of the HNRNPK protein (λex = 280 nm) with increasing amount of RNA (0.0 to 0.13 µM). Table shows the calculated equilibrium parameters. c BAMscale peaks over IER3/IER3-AS1 locus from RNA-seq data of control and CRISPR/cas9 IR deleted HeLa cells. d Schematic view of IER3-AS1 deletions and CCTCC motif mutations. Bar graph of MTT assay showing the percentage of cell proliferation. e IF-RNAscope images of control and hnRNPK KD HeLa cells showing J2 (dsRNA-specific antibody) immunostaning, coupled with RNAscope using IER3 (red) and IER3-AS1 (green) probes. The right-side panels show 3D reconstructed cell images (Imaris) of the merged image indicated by white dotted box. IER3-AS1 (green dots marked with white arrows) and J2/IER3/IER3-AS1 colocalized signals (brownish-yellow dots marked with red arrows). The spheres from the 3D reconstructed images detected using spot detection tool. J2 - Pink spheres, IER3-AS1 - green spheres and IER3 - red spheres. Upper right corner shows magnified co-localized spots in an inset. Indicative scale bar is 50 um. Graph to the right shows the numbers of J2 signals in control (n = 81) and hnRNPK KD (siRNA1: n = 74 and siRNA2: n = 75) cells. Data represents mean with ±SEM from n = 3 independent experiments. P value calculated by One-way ANOVA (Sidak’s multiple comparisons test). Dot plots shows the average number of J2/IER3-AS1/IER3 co-localized signals (n = 120 cells were manually counted from 3 independent experiments). P value was calculated by one-way ANOVA (Kruskal–Wallis test). f RIP assay, performed using J2 antibody, showing the fold enrichment of IER3 and IER3-AS1 transcripts over IgG. HPRT and GAPDH (negative controls) and ERVL (positive control). g RT–qPCR showing the enrichment of IER3:IER3-AS1 dsRNA (RNaseA treated) over ssRNA (RNaseA untreated). The expression values were normalized with GAPDH. ERVL and MTL2B4 are positive controls. h IF images of HeLa cells showing J2 signals. Magnified J2 signals (puncta) were shown in an inset indicated by white box. Indicative scale bar is 50 um. Graph shows the number of J2 signals quantified using Imaris spot detection tools. A total, control: n = 63, siRNA1: n = 51 and siRNA2: n = 57 cells were counted from three experiments. P value calculated by One-way ANOVA. Data represent mean ± SDfrom two independent biological replicates. P value was calculated by two-sided Student’s t-test for (d, f and g) (*p ≤ 0.05; **p ≤ 0.005; ***p ≤ 0.0005,****p ≤ 0.0001).

