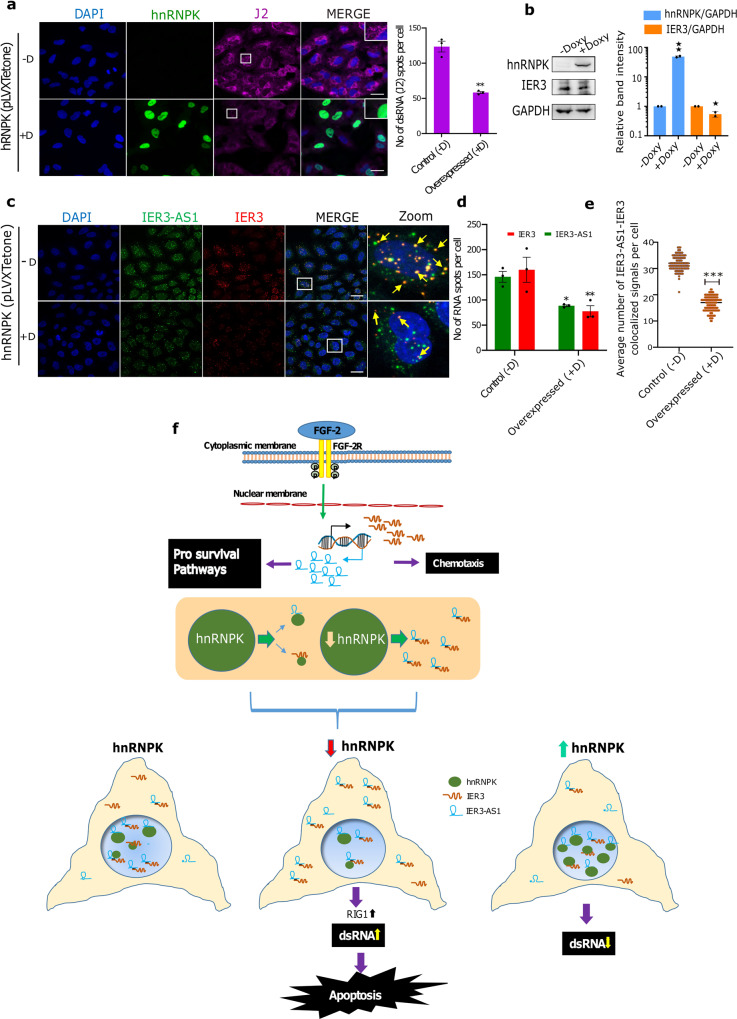
Fig. 7. HnRNPK overexpression suppresses global dsRNA levels.
a Representative immunofluorescence images showing the effect of doxycycline (DOX) induced overexpression (−DOX/+DOX) of HnRNPK (green) on global dsRNA as detected using J2 antibody (red) in A549 cells. Panel to the right shows the merged images. Magnified J2 signals (puncta) are shown in an inset at the upper right corner indicated by white box. Indicative scale bar on the images is 50 um. Bar graph to the right shows the number of J2 signals in HnRNPK non-induced (−DOX (−D); n = 81 cells) and HnRNPK induced (DOX+(+D); n = 53 cells) cells from three replicates quantified as RNA spots per cell using Imaris spot detection tools. Data are presented as mean values +/−SEM. Statistical significance was calculated by Two-tailed unpaired t-test. b Immunoblot showing the levels of HnRNPK and IER3 in −DOX (−D) and +DOX (+D) A549 cells. GAPDH was used as an internal loading control. The similar results were observed in an independent experiment. Histograms showing the relative band intensities of the western blot are shown left side. The p values were calculated using two-sided Student’s t-test and data are presented ± SD from two independent replicates. c RNAscope images of DOX (−D/+D) induced HnRNPK cells showing IER3 (red) and IER3-AS1 (green) in control (−D) and hnRNPK overexpressed (+D) cells. Panel to the right showing magnified images of the merged panel indicated by white box. Yellow arrows depict colocalized IER3/IER3-AS1 dsRNA (yellow dots). Indicative scale bar on the images is 50 um. d Bar graph showing the number of IER3-AS1 and IER3 RNA signals per cell in control (−D; n = 80 cells) and hnRNPK overexpressed (+D; n = 121 cells) cells quantified using Imaris spot detection tools from three replicates. Data are presented as mean values +/−SEM. Statistical significance was calculated by Two-way ANOVA (Sidak’s multiple comparisons test. e Dot plots showing the average number of colocalized signals of IER3-AS1/IER3 (dsRNA) per cell in control (−D) and hnRNPK overexpressed (+D) cells. A total of 150 cells were manually counted from three independent replicates. Data are presented as mean values + / SEM. Statistical significance was calculated by Two-tailed unpaired t-test. For figures (a, d and e) *p ≤ 0.05; **p ≤ 0.005; ***p ≤ 0.0005. f Model explaining the role of HnRNPK in the regulation of global dsRNA.

