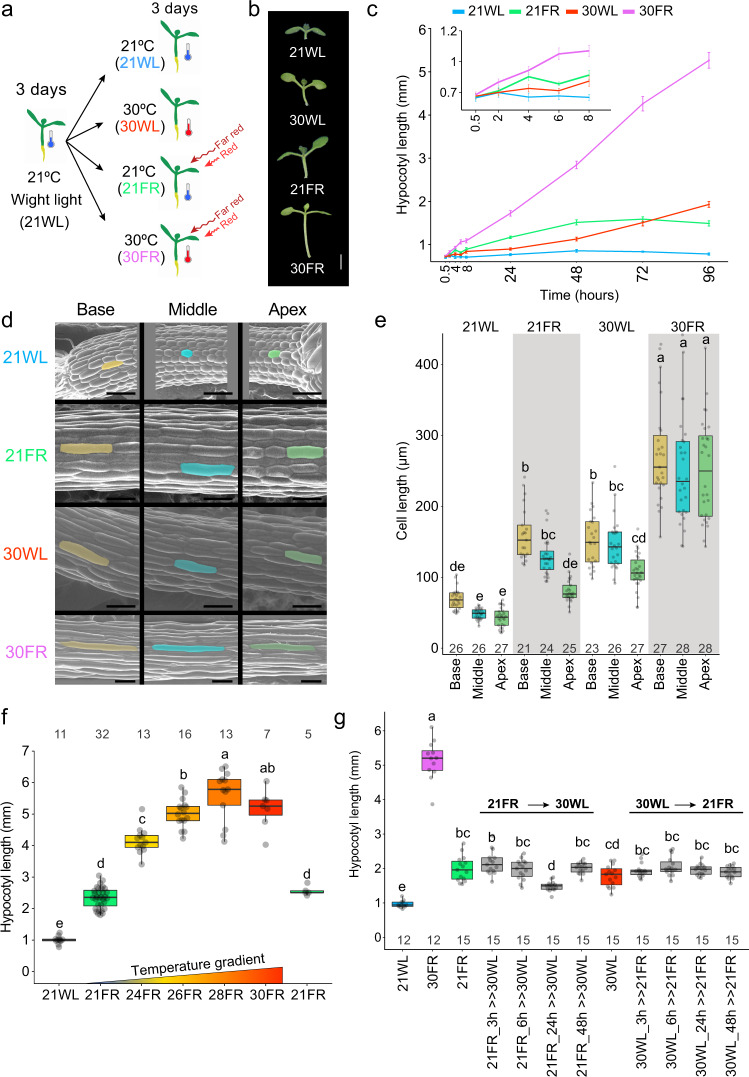
Fig. 1. Synergistic hypocotyl elongation under combined shade and warm temperature.
a Scheme of the experimental design. Seedlings were grown in 21 °C with constant simulated white light (WL) for 3 days and then moved to 30 °C (30WL), 21 °C with shade (21FR, R/FR = 0.6), 30 °C with shade (30FR, R/FR = 0.6) or kept at 21 °C white light (21WL) for three more days. b Representative images of 6-day-old Arabidopsis wild-type seedlings grown as described in (a). Scale bar = 2 mm. c Hypocotyl length of wild-type seedlings during the first 4 days after transfer to the different conditions. Insert is an enlargement of the first hours. The average values +/− SE are shown, n = 8 or more seedlings per time point (for the exact number in each sample, see Source data). d Representative SEM images of hypocotyl epidermal cell lengths at the apex, base, and middle of 6-day-old seedlings grown as described in (a). We repeated the experiment five times with similar results. Scale bar = 100 µm e. Hypocotyl epidermal cell length was determined from confocal images of 8–9 seedlings per condition and 2–3 cells per segment. The number of cells (n) is shown under each box. f Hypocotyl length of 6-day-old wild-type seedlings grown for 3 days at 21WL and then moved to the indicated temperature and light. The response to 21FR is shown for two different chambers used for the experiment. The number of seedlings (n) is shown on top of each box. g Hypocotyl length of 6-day-old wild-type seedlings grown for 3 days at 21WL, then moved to the indicated conditions. In gray, the plates were transferred from 21FR to 30WL or from 30WL to 21FR, after the indicated time and stayed there for the rest of the experiment. The number of seedlings (n) is shown under each box. In b–g, PAR = 70 µmol m−2 s−1. In e–g, Different letters denote statistical differences (p < 0.05) among samples as assessed by one-way ANOVA and Tukey HSD. Boxes indicate the first and third quartiles and the whiskers indicate the minimum and maximum values, the black lines within the boxes indicate the median values and gray dots mark the individual measurements.

