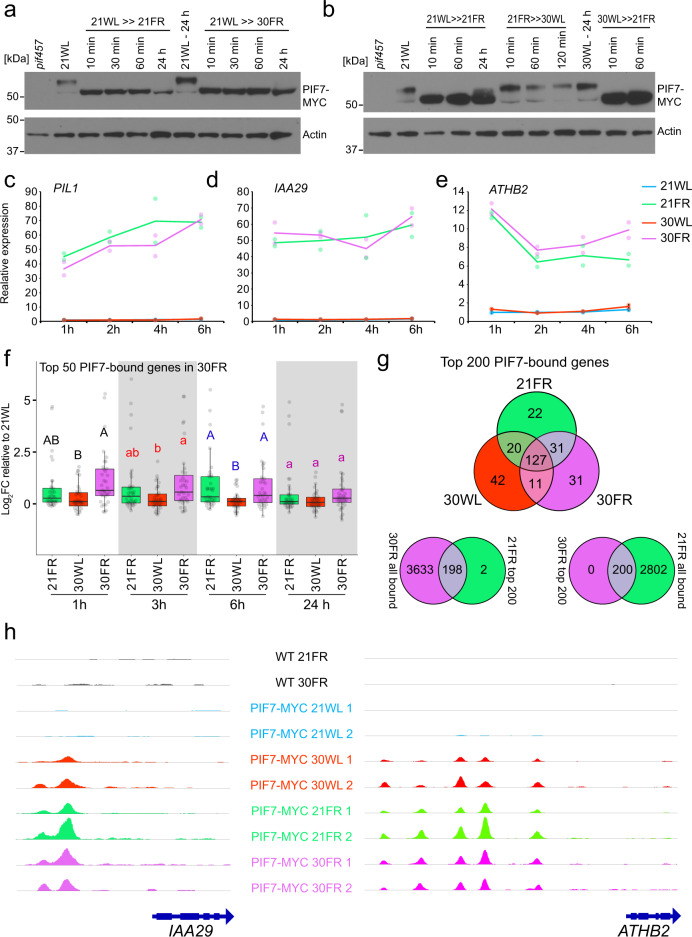
Fig. 4. PIF7 activity is comparable in low R/FR at low or high temperature (21FR vs 30FR conditions).
a Immuno-detection of PIF7-MYC Protein levels using anti-MYC antibody. Total protein extract was collected from 3-day-old PIF7:PIF7-4xMYC (pif457) seedlings grown in 21WL (70 µmol m−2 s−1) plus the indicated time in the stated conditions. Anti-ACTIN blots are shown below as loading controls. This experiment was done one time. b Same as (a) except protein extract was collected after 24 h in the indicated starting condition plus the stated time in the treatment condition. This experiment was done one time. c–e Expression of PIL1 (c), IAA29 (d), and ATHB2 (e) in 3-day-old seedlings grown at 21 °C in 21WL (70 µmol m−2 s−1) plus the indicated time in the stated conditions. The expression from the RNA-seq data is shown as normalized counts per million reads mapped (cpm), and as the average of two biological replicates per condition. Color dots mark the individual measurements. f Relative expression of the top 50 PIF7-bound genes in 30FR that are also differentially expressed in at least one condition of the RNA-seq (FDR < 0.05, n = 31). Log2FC: Log2 Fold Change relative to 21WL at each time point. Different letters denote statistical differences (p < 0.05) within time points assessed by one-way ANOVA and Tukey HSD. Boxes indicate the first and third quartiles and the whiskers indicate the minimum and maximum values, the black lines within the boxes indicate the median values and gray dots mark the individual measurements. g Venn diagram comparing the top 200 PIF7-bound genes in 21FR, 30WL, and 30FR. Bound genes were annotated if a peak was found 2 kb upstream to the TSS or in the gene body in both replicates of each growth condition. All top 200 genes in 30FR were also bound in 21FR (all genes) and all top 200 genes in 21FR were also bound in 30FR (all genes) except two (see Supplementary Data 4 for the top 200 genes in each condition). h Visualization of PIF7-MYC binding to the IAA29 and ATHB2 promoters. Note that differences in binding peak intensities between replicates might be due to differences in library preparation and data analysis between replicates 1 and 2 (see “Methods” section). Light and temperature conditions in a–g were the same as in Fig. 1.

