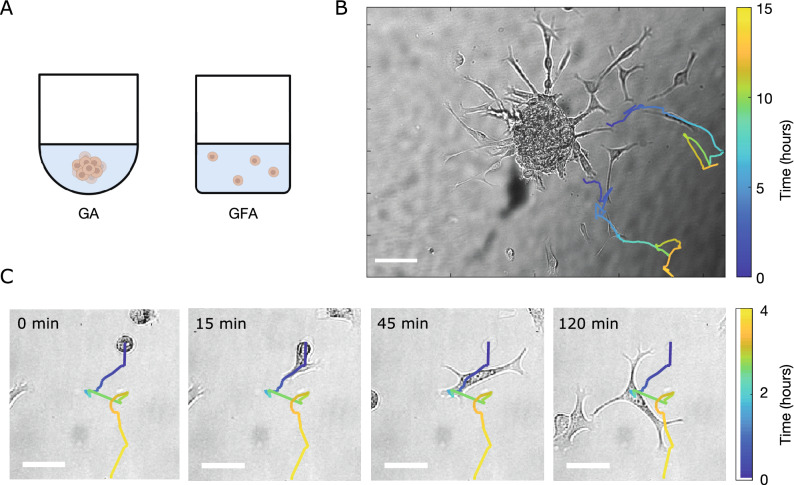
Figure 1.
Brain cancer cells invading the ECM. (A) Schematics of an ECM-embedded spheroid in a gradient assay (GA) or individual cells in a gradient-free assay (GFA). (B) Tracks of migrating cells in a GA from and , respectively, superimposed on the corresponding bright field image. For each track, the color bar indicates time evolution. Scale bar is . (C) Morphological transition of a cell prior to migration. Image sequence of brain cancer cells invading the ECM at min in GFA. The track of the cell is superimposed on the bright field image. The color bar indicates time evolution and the scale bars are .

