Figure 2.
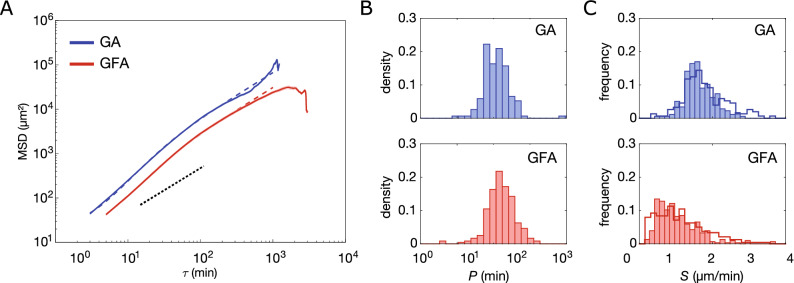
Ensemble-averaged mean-squared displacement analysis. (A) GA (N=177) and GFA (N = 305) (mean ± SEM) on double-logarithmic scale. Dashed lines correspond to fitting of Eq. 2 (). Black punctuated line has a slope of 1, which corresponds to a diffusive motion and is inserted as a guide to the eye. (B) Distributions of persistence times, P on a log-normal scale, of the cells in GA ( with ) and in GFA ( with ). Values are obtained from the msd-analysis described in Eq. (2). (C) Distributions of migration speed, S, for GA and GFA, both fitted from Fürth’s formula (full line) as in (B) and from averaging over the individual trajectories (bars) calculated from Eq. (4).

