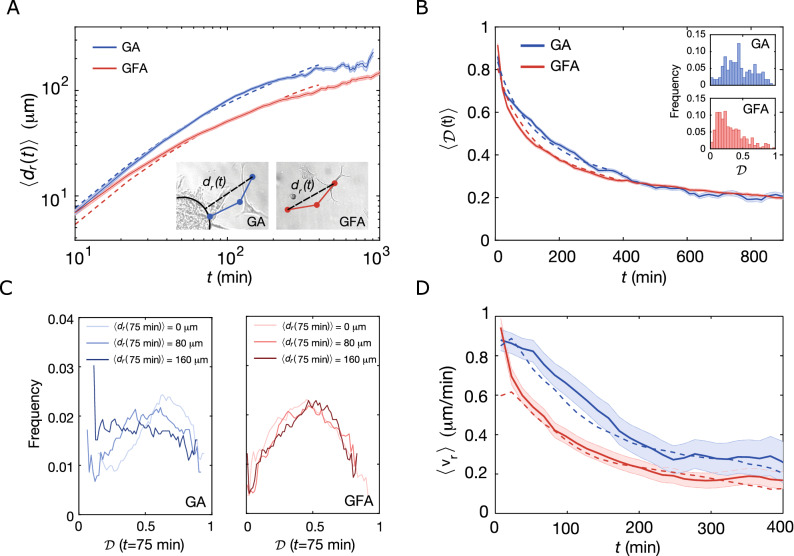
Figure 4.
Time evolution of migration patterns. (A) Time-dependent ensemble-averaged radial displacement, , versus time, t, (mean ± SEM) for GA (N=177) and GFA (N = 305) on a double-logarithmic scale. Dashed lines correspond to results obtained from BPRW (blue) and PRW (red) simulations. Insets: Sketches defining the radial displacement, , for GA and GFA, respectively. (B) Time evolution of the ensemble-averaged directionality, (mean ± SEM) for GA (N = 177) and GFA (N = 305). The dashed lines are averages over simulated tracks for BPRW (blue) and PRW (red). Insets: Distribution of the directionality of the entire trajectories, . (C) Distribution of directionalities of the trajectories after min, , at different distances from initial position, , for GA (blue) and GFA (red). (D) Time-evolution of the ensemble-averaged radial velocity, , (mean ± SEM) for GA and GFA and simulated trajectories (dashed lines) from BPRW (blue) and PRW (red). In all four cases, was binned over 15 min with a moving average of 10 data points.

