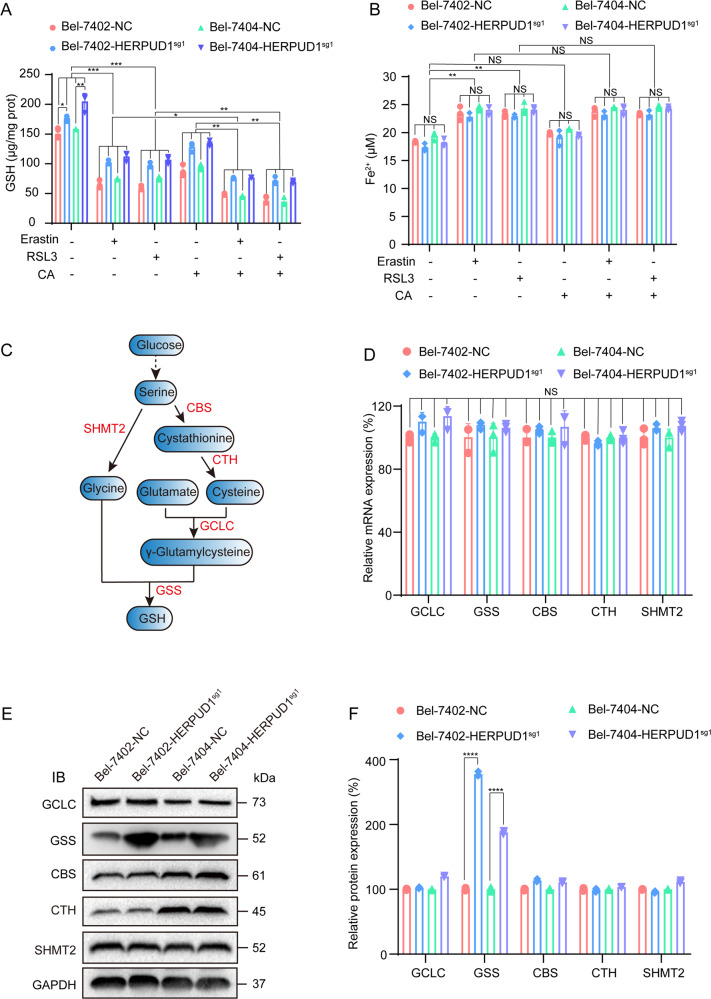
Fig. 4. HERPUD1 downregulates GSH by reducing the protein level of GSS.
A, B GSH and Fe2+ content in liver cancer cells with or without HERPUD1 after adding erastin, RSL3, CA. C The ferroptosis-related metabolic axis from glucose to GSH. D mRNA levels of GCLC, GSS, CBS, CTH, and SHMT2 were analyzed by qPCR in Bel-7402 and Bel-7404 cells with or without HERPUD1. E Protein levels of GCLC, GSS, CBS, CTH, and SHMT2 were analyzed by immunoblotting in Bel-7402 and Bel-7404 cells with or without HERPUD1. F The relative protein level of GCLC, GSS, CBS, CTH, and SHMT2 are normalized according to the level of GAPDH calculated by ImageJ software. The data were analyzed using Student’s t test and shown as the mean ± SD from three biological replicates. *P < 0.05; **P < 0.01; ***P < 0.001 indicates statistical significance.

