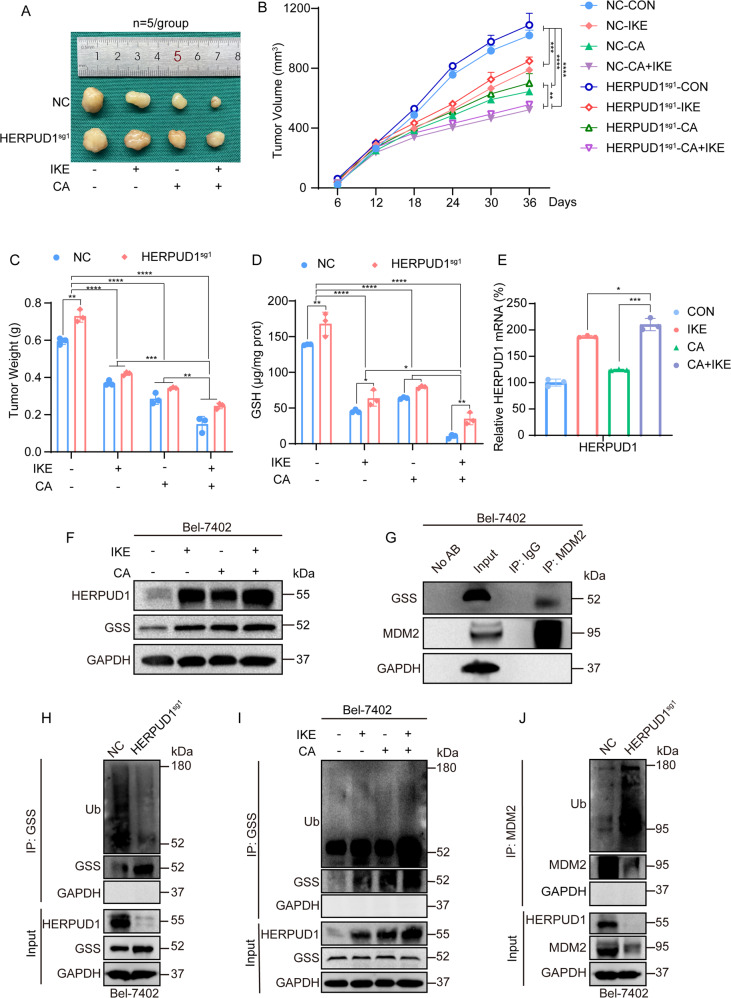
Fig. 6. In vivo experiments demonstrate that CA increases ferroptosis sensitivity through HERPUD1.
A Representative tumor pictures after CA (10 mg/kg), IKE (50 mg/kg), CA and IKE combined treatment (n = 5/group). B Tumor growth curve monitored for 36 days, tumor volume (mm3) = 0.5 × length × width2. C Tumors weighed after 36 days. D GSH content in tumors was detected after drug treatment using a GSH kit. E mRNA levels of HERPUD1 in tumors were analyzed by qPCR assay after drug treatment. F Protein levels of HERPUD1 in tumors were analyzed by immunoblotting. Representative images of IB were shown in the figure. G The interaction of GSS and MDM2 in tumors were detected by co-IP experiments. H Total ubiquitination of GSS, as co-IP by anti-GSS antibody for the indicated treatment in Bel-7402 cells with or without HERPUD1 knocked out, and measured by anti-total ubiquitin antibody. I Total ubiquitination of GSS, as co-IP by anti-GSS antibody for the indicated treatment in Bel-7402 cells with or without drug treatment, and measured by anti-total ubiquitin antibody. J Total ubiquitination of MDM2, as co-IP by anti-MDM2 antibody for the indicated treatment in Bel-7402 cells with or without HERPUD1 knocked out, and measured by anti-total ubiquitin antibody. Images of all the immunoblots are representative of three independent experiments. Data were analyzed using Student’s t test and expressed as mean ± SD from three biological replicates. *P < 0.05; **P < 0.01; ***P < 0.001 indicates statistical significance.

