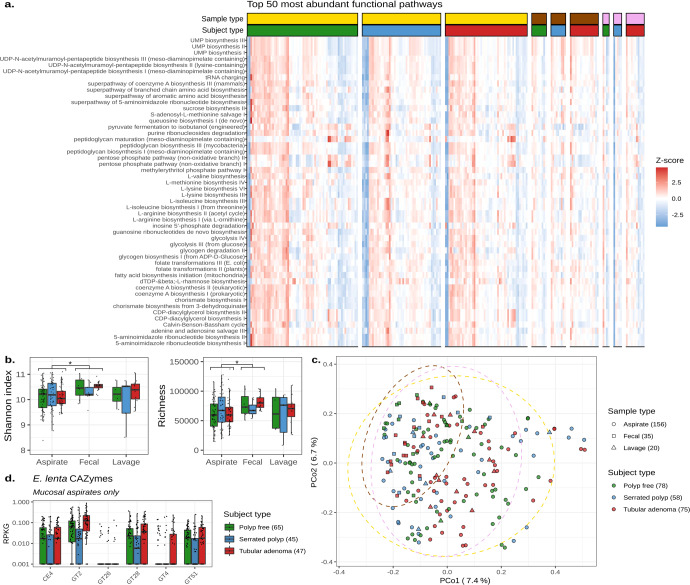
Fig. 5. Microbiome functional potential is distinct across sampling methods and subject types.
a A heatmap displaying the z-scores of the top 50 most abundant microbial pathways found within the second sample set. Each column is one sample, with multiple samples per individual. Samples are clustered by sample and subject types. Yellow represents mucosal aspirates, brown represents fecal samples, and purple represents lavage aspirates. Within-subject types, green represents polyp-free samples, blue represents serrated polyp samples, and red represents tubular adenoma samples. b Box plots showing the Shannon diversity and richness of individual microbial genes across the second sample set mucosal aspirates, lavage aspirates, and fecal samples. Significant comparisons (Linear-mixed effects: p < 0.05) are denoted with an asterisk (*). c Principal coordinate analysis of per-gene Bray–Curtis dissimilarities. Each point represents one sample. Ellipses are drawn to represent the 95% confidence interval of each sample type’s distribution. The number of samples per sampling method and subject type are annotated parenthetically. d Box plots showing the abundance of E. lenta-specific carbohydrate-active enzymes in reads per kilobase per genome equivalent. Only mucosal aspirates from the second sample set are shown, with the number of mucosal aspirates per subject type being denoted parenthetically. The center line within each box defines the median, boxes define the upper and lower quartiles, and whiskers define 1.5x the interquartile range. Source data are provided as a Source Data file.

