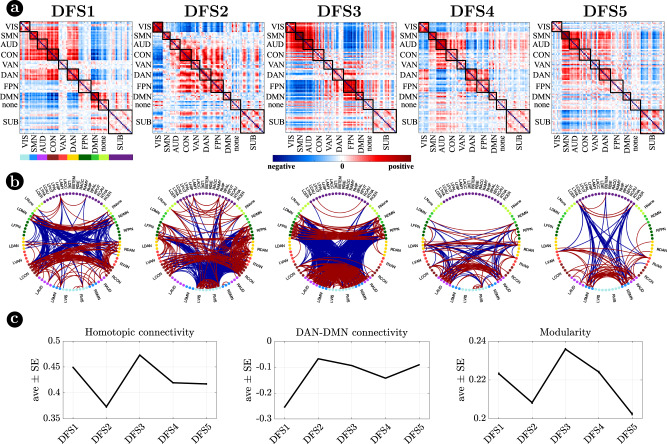
Fig. 2. Dynamic functional states (DFSs).
a Representation of the 5 DFSs in matrix form (positive and negative weights are red and blue, respectively). b The same DFSs are described through a circular graph representation. In each column, the positive (red) and negative (blue) strongest links for each state are represented. Network belonging is color-coded. c Average and standard error of (left) the average homotopic inter-hemispheric connectivity within each network; (center) the average connectivity between dorsal attention network (DAN) and the default mode network (DMN) regions, as a measure of task-positive and task-negative network integration); (right) the overall Newman’s modularity among cortical networks. Data are reported as mean values +/− SEM. Source data are provided as a Source data file.

