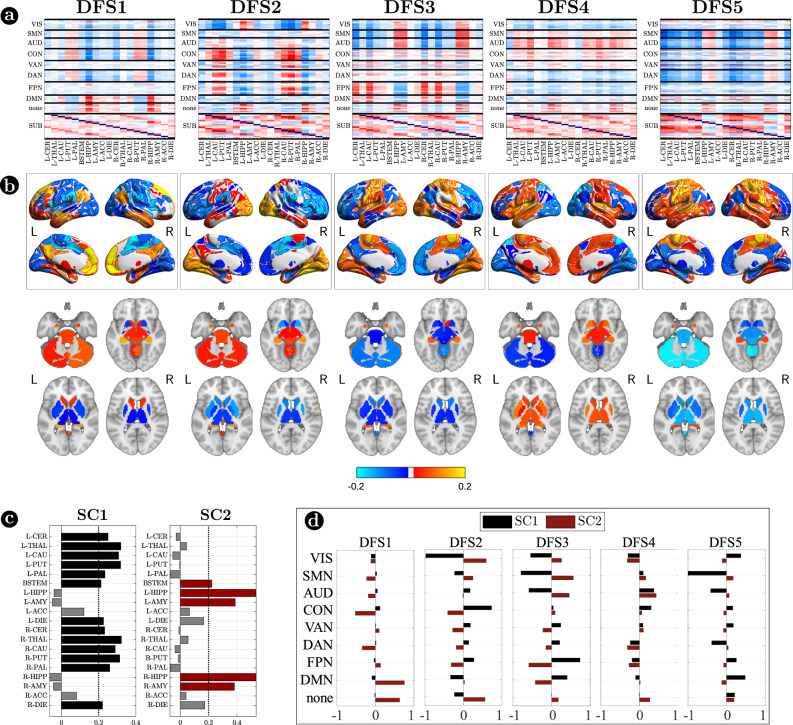
Fig. 3. Cortico-subcortical interaction in the dynamic functional states (DFSs).
a Matrix representation of cortico-subcortical interaction. This is a zoom of Fig. 2a. Positive and negative values are indicated with red and blue, respectively. b Surface and volume projection of the first eigenvector of each DFSs. Cortical regions are shown in surface (top), while subcortical regions in volume (bottom). c Loading of each subcortical regions in the two main subcortical components. A threshold of 0.2 has been used. d Average connectivity between each subcortical component (SC1 and SC2) with each cortical network in the different DFSs. Source data are provided as a Source data file.

