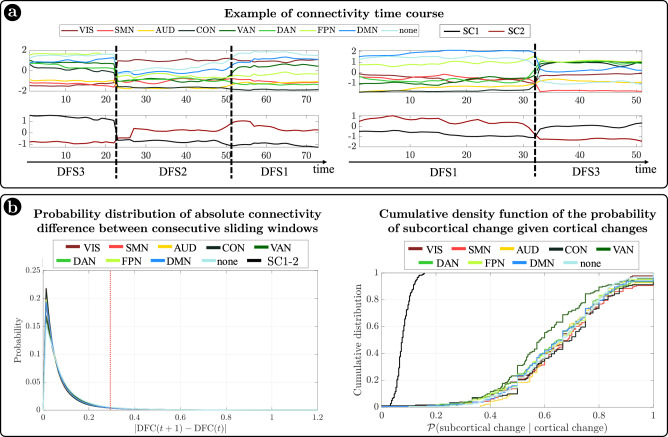
Fig. 4. Cortical and subcortical dynamics.
a Two examples of average connectivity during time for cortical networks (top) and subcortical clusters (bottom). The vertical dashed lines indicate the switching between dynamic functional states (DFSs). b (Left) Probability distribution of the absolute values of connectivity differences between consecutive sliding windows. Each line represents a different network. Right) Cumulative density function of the conditioned probability of subcortical connectivity reorganization, given a cortical connectivity reorganization. Each colored line relates to a different cortical network. The black line shows the cumulative density function under the null hypothesis of independence between cortical and subcortical changes. Source data are provided as a Source data file.

