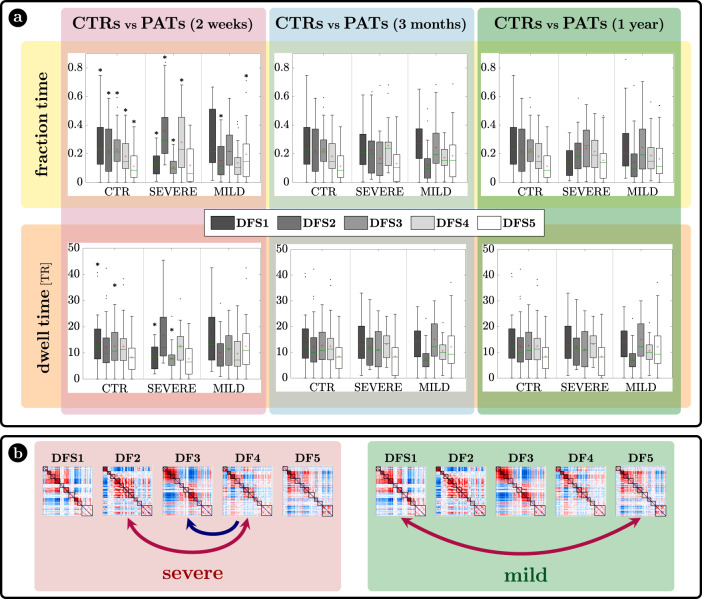
Fig. 5. Results.
a Fraction time and lifespan. This figure represents two dynamical measures related to the dynamic functional states (DFSs), namely the fraction time (top) and the average dwell time (bottom). Comparisons between healthy controls (CTRs) and stroke patients (PATs) at different conditions are represented. To be noticed: (i) fraction times and dwell times show similar patterns, but fraction times are more sensitive to identify group differences, and (ii) all dynamic impairments identified at the sub-acute stage, recovered in the chronic stage. The significance between each pair of groups has been tested independently for each of the 5 DFSs through one-sided non-parametric permutation tests, and false discovery rate (FDR) correction for 15 comparisons. The symbol * indicates p-value < 0.05 after FDR correction. For each panel: n = 40 (CTRs), 18 (PATs severe), 29 (PATs mild). On each box: the central green line indicates the median, the red cross indicates the mean, and the bottom and top edges of the box indicate the 25th and 75th percentiles, respectively. The whiskers extend to the most extreme data points, not considered outliers (plotted individually using a dot). b Graphical representation of the significant differences in transition probabilities between CTRs and patients at the sub-acute stage: red arrows represent increase in probability, while blue arrows stand for decreased transition probabilities. Source data are provided as a Source data file.

