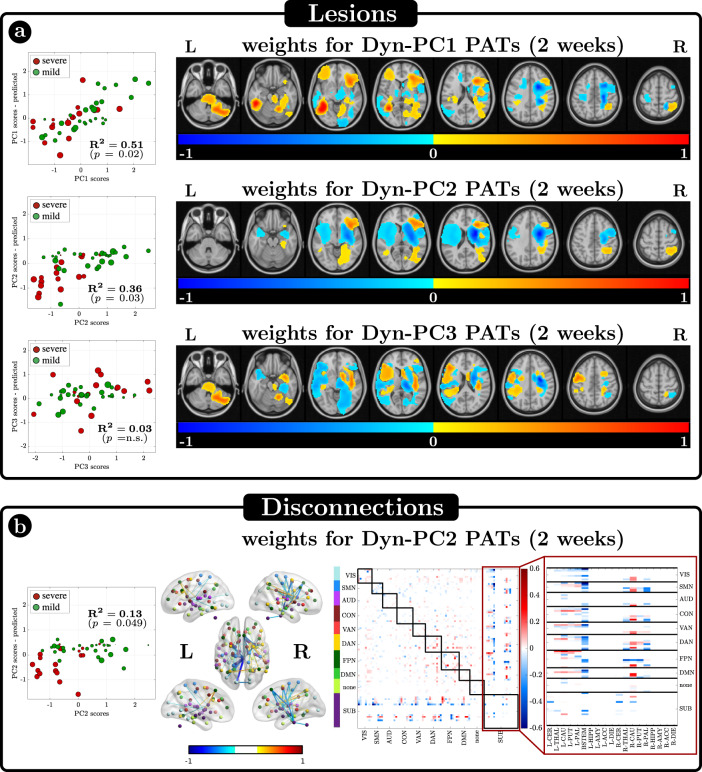
Fig. 6. Relationship between dynamic principal components (Dyn-PCs) and lesions or disconnections.
a Results of the Ridge Regression (RR) algorithm aimed at identifying possible existing relationships between the scores of the dynamical PCs and the anatomical lesions. On the left, the scatter plots between real and estimated values are shown, for the 3 Dyn-PCs. Each dot is a patient, whose stroke severity (severe or mild) is color-coded and whose lesion size is described by the dot dimension. R2 is the amount of variance explained by each model, and p the model significance. Only Dyn-PC1 and Dyn-PC2 are significantly described by RR models. On the right, the estimated optimal weights are represented, after normalizing w.r.t. their maximum absolute value. b Results of the Ridge Regression (RR) algorithm aimed at identifying possible existing relationships between Dyn-PC2 and the structural disconnections. On the left, the scatter plot between real and estimated values is shown. On the right, the significant disconnection weights are represented both in matrix form (right) and projected into the brain (left). Source data are provided as a Source data file.

