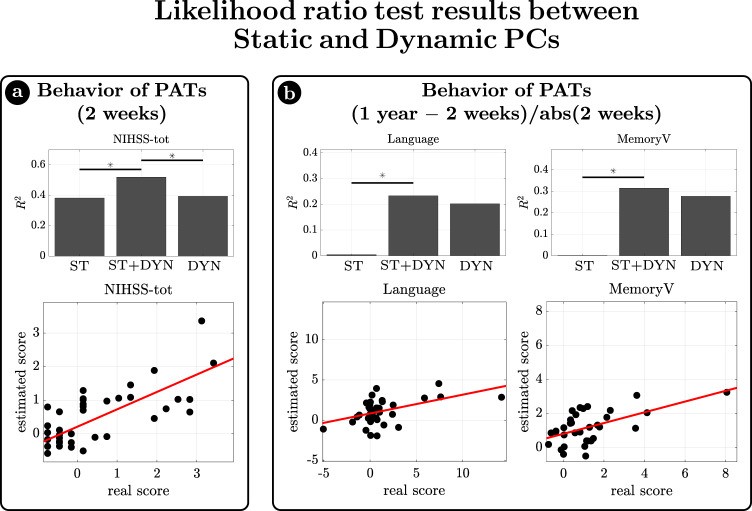
Fig. 7. Relationship between Dynamic measures and behavior.
The ratio likelihood test was used to test whether the addition of dynamic information to the static measures would significantly increase the ability of a generalized linear model to describe behavioral deficits (in terms of explained variance). Static measures were represented by static principal component (ST) values, while dynamic information was represented by dynamic principal components. a At first behavioral scores of sub-acute patients were considered. When dynamical PCs were used as dynamic regressors, only the global measure of behavioral impairment (NIHSS-total) resulted to be better estimated by the combination of static and dynamic regressors, than only static ones. The bar plot shows the for the reduced (only static, ST) model, for the unreduced (static and dynamic, ST+DYN) model, and for the reduced model (only dynamic, DYN). b As a second step, we used static and dynamic measures at sub-acute stage, to explain the difference in behavioral scores from 2 weeks to 1 year. When dynamical PCs were used as dynamic regressors, the explanation of score changes in Language and Visual Memory task was significantly better. Source data are provided as a Source data file.

