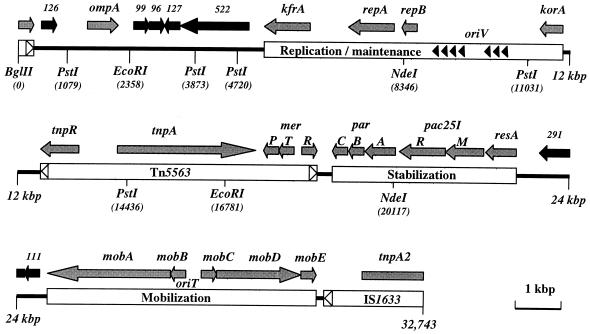
FIG. 1.
Genetic and physical maps of plasmid pRA2 as deduced from the DNA sequence. The complete genome is represented by three horizontal lines that are marked in kilobase pairs (kbp) and drawn to scale. Predicted gene products are illustrated above the genome by shaded arrows (function predicted) and solid arrows (unknown function). The plasmid has been separated into regions that are involved in replication, stability, and mobilization. The mobile elements Tn5563 and IS1633 are also shown, and their terminal inverted repeats are marked by unshaded arrowheads. Solid arrowheads represent the seven iterons of the replication region. All of the PstI, EcoRI, NdeI, and BglII restriction sites are shown (positions in base pairs [bp]). The BglII site was arbitrarily taken as coordinate 1 and appears to cleave IS1633 and its gene, tnpA2, but both of these elements are in fact continuous.

