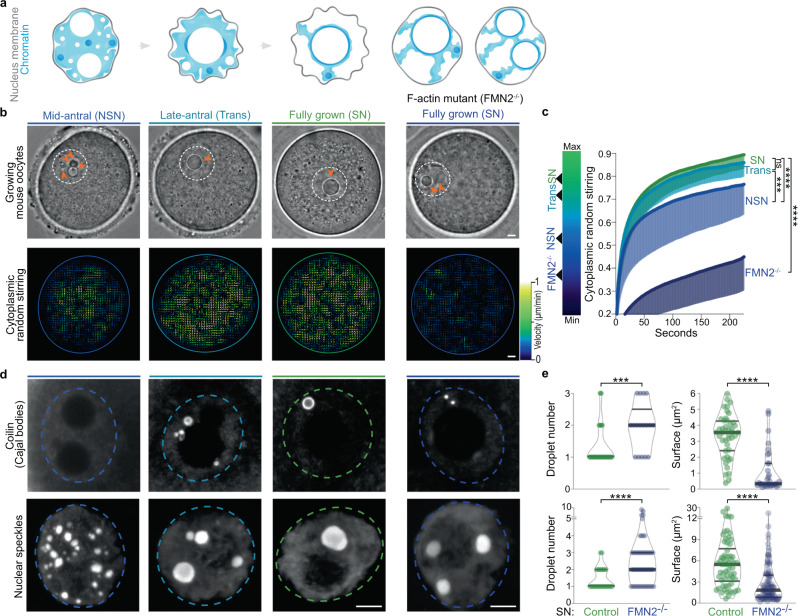
Fig. 1. Nuclear biomolecular condensate patterns during mouse oocyte growth correlate with cytoplasmic remodeling.
a Illustration of chromatin configuration evolution (non-surrounded nucleolus (NSN), transitioning (Trans), surrounded nucleolus (SN)) coinciding with oocyte growth subcategories (mid-antral follicle, late-antral follicle, and fully grown); (left) large spherical nucleoli decrease in number and increase in size as of the Trans-stage; (right) chromatin configuration scenarios in fully grown cytoplasmic F-actin mutants (FMN2−/−) with one large or two smaller nucleoli. The nuclear membrane (gray) is depicted according to fluctuation intensity. b Top: Bright-field images of Control oocytes with growth progression and a fully grown mutant; the nucleus is in dashed white and orange arrowheads indicate multiple small nucleoli (NSN and FMN2−/− SN) or a single large nucleolus (Trans and SN). Bottom: Growth-associated cytoplasmic stirring vector maps generated by STICS analyses of bright-field 240 s-stream videos; the oocyte cortex is outlined with colors reflecting the intensity of cytoplasmic stirring; maps are color-coded according to velocity magnitude (lowest in dark blue, strongest in white). c Cytoplasmic random stirring intensity in time measured in Control NSN to SN and FMN2−/− SN oocytes by image correlation analyses of cytoplasmic pixel evolution; color gradient (left) used in this study to represent cytoplasmic stirring intensity; cell number, Control NSN = 22, Trans = 19, SN = 28 cells, FMN2−/− SN = 13; error bars represent mean-s.d. d Representative immunoreactivities of Coilin and nuclear speckles in growing Control oocytes and SN FMN2−/− oocytes; Coilin images are 0.5 μm z-planes and nuclear speckle images are 20 μm z-projections; nucleus regions outlined with dashed circles. e Quantifications of Coilin (top) and nuclear speckle (bottom) droplet number and surface in nuclei of fully grown SN Control and mutant oocytes; Coilin, counted in 43 Control and 17 FMN2−/− cells, measured 44 Control and 33 FMN2−/− droplets; speckles, counted in 41 Control and 52 FMN2−/− cells, measured 62 Control and 112 FMN2−/− droplets; violin plots with median ± quartiles. P values derived from two-tailed Mann–Whitney U-tests, ns not significant, P = 0.074, ***P < 0.0004, ****P < 0.0001; color codes based on cytoplasmic stirring intensities; scale bars, 5 μm. Source data are provided as a Source Data file.

