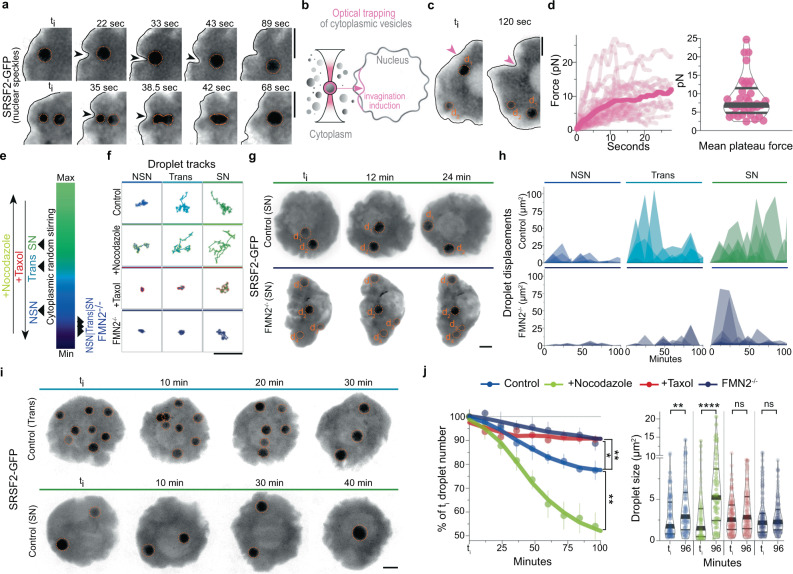
Fig. 2. Cytoplasmic forces drive mesoscale condensate collision-coalescence in the nucleus.
a Time-lapse images of nuclear membrane invaginations displacing nucleoplasmic SRSF2-GFP droplets in Trans (top) or NSN (bottom) cells; black arrowheads indicate nuclear membrane invaginations; membrane outlined in black. b Illustration of optical trapping experiment; cytoplasmic vesicles close to the nucleus were trapped and pushed against the nuclear membrane to exert forces and induce nuclear membrane invaginations. c Time-lapse showing a nuclear membrane invagination induced by the optical trapping approach, displacing a nucleoplasmic SRSF2-GFP droplet in a Trans cell; pink arrowhead indicates a point of contact between the trapped vesicle and nuclear membrane. d Individual force tracks in time (left) and mean plateau forces (right) obtained with optical trapping; 37 measurements from 20 oocytes. e Color gradient representing the intensity of cytoplasmic forces in growing Control and mutant oocytes or Controls treated with microtubule inhibitors. f Representative SRSF2-GFP droplet 2D-space exploration (50 s-tracks) at the three growth stages in Control oocytes, Controls incubated with Nocodazole or Taxol, and FMN2−/− oocytes. g Time-lapse 50 μm z-projections of SRSF2-GFP droplet displacements in the nucleoplasm of fully-grown SN Control and FMN2−/− oocytes. h Fluctuating displacements of SRSF2-GFP droplets in Control and FMN2−/− oocytes at three stages of growth; droplet number in Control, NSN = 8, Trans = 5, SN = 6; in FMN2−/−, NSN = 12, Trans = 11, SN = 26. i Control SRSF2-GFP droplet dynamics (50 μm z-projections) in Trans and SN cells. j Nuclear SRSF2-GFP droplet collision-coalescence speed. (Left) nuclear SRSF2-GFP droplet number evolution (in % of initial droplet number) with Control, amplified (+Nocodazole), or disrupted cytoplasmic forces (+Taxol or FMN2−/−) in NSN oocytes; four oocytes per condition; error bars represent mean ± s.e.m.; P values derived from two-tailed Wilcoxon matched-pairs signed rank tests, *P = 0.0195, **P < 0.0078. (Right) nuclear droplet surface at the initial timepoint (ti) and t = 96 min; droplet number, Control ti = 113,t96 = 96, Nocodazole ti = 93,t96 = 58, Taxol ti = 114,t96 = 104, FMN2−/− ti = 141,t96 = 124; violin plots with median±quartiles; P values derived from two-tailed Mann–Whitney U-tests, ns not significant, P > 0.177, **P = 0.0071, ****P < 0.0001. Droplets in a, c, g, and i are outlined in dashed orange; color codes based on cytoplasmic stirring intensities; scale bars, 5 μm. Source data are provided as a Source Data file.

