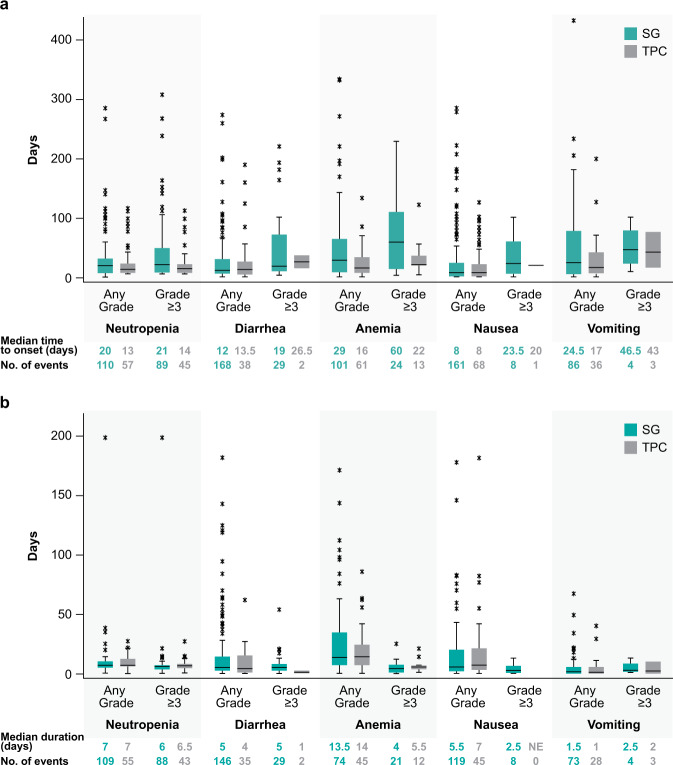
Fig. 1. Time course of treatment-related adverse events of special interest.
a Time to onset of first event of treatment-related AESI and (b) duration of an individual episode of treatment-related AESI of any grade and grade ≥3 in the Safety Population. Box and whisker plots, with upper and lower boundaries of each box plot representing the 25th and 75th percentiles and the horizontal lines within the box representing median values. Whiskers extend to the last observation if it was not an outlier (defined as greater than Q3 + 1.5 × IQR or less than Q1–1.5 × IQR) or to the minimum/maximum values if an outlier was not identified. Outliers are indicated by an asterisk. AESI adverse event of special interest, IQR interquartile range, Q1 first quartile, Q3 third quartile, SG sacituzumab govitecan, TPC treatment of physician’s choice.

