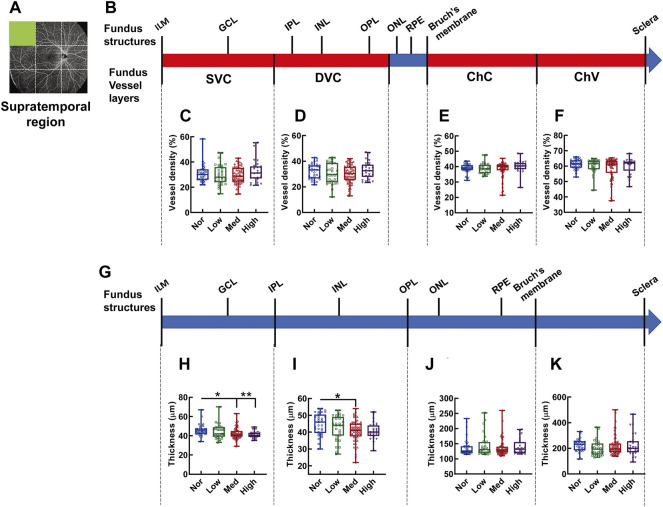
FIGURE 3.
Vessel layer densities and structure thicknesses at the supratemporal region of the fundus. Position of the supratemporal region of the fundus is illustrated in (A). Schematic illustration of vessel layers in the fundus is shown in (B). Vessel densities of superficial vascular complex (C), deep vascular complex (D), choriocapillary (E), and choroidal vessel (F) layers were quantified and compared. Schematic illustration of segments in the fundus is shown in (G). Thicknesses of the segments from IML to IPL (H), from IPL to OPL (I), from OPL to Bruch’s membrane (J), and from Bruch’s membrane to the sclera (K) are quantified and compared. * p < 0.05, ** p < 0.01. SVC, superficial vascular complex; DVC, deep vascular complex; ChC, choriocapillary layer; ChV, choroidal vessel layer; NOR, normal group; Low, low-myopia group; Med, medium-myopia group; High, high myopia group; IML, inner limiting membrane; IPL, inner plexiform layer; and OPL, outer plexiform layer.

