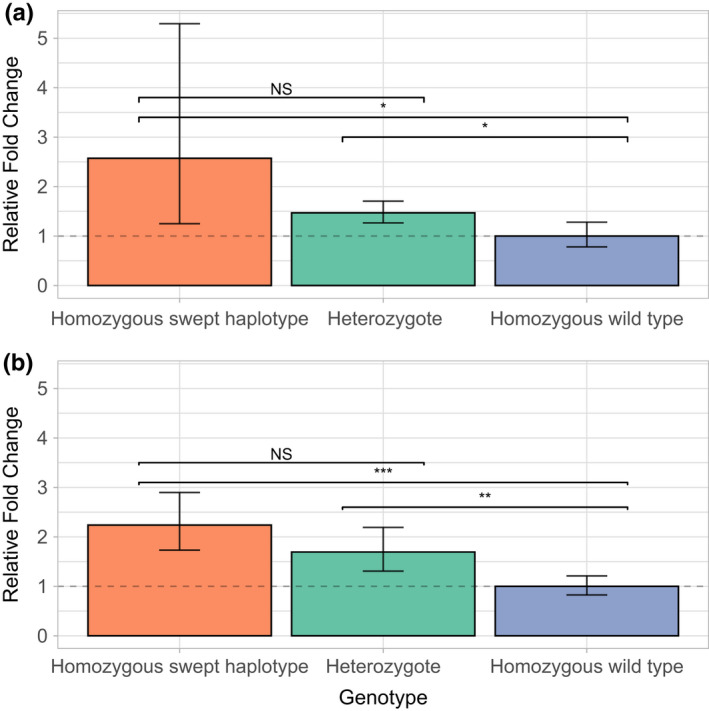
FIGURE 4.

Gene expression analysis of Cyp6p4 and Cyp6aa1 in genotyped Anopheles gambiae females. Relative fold change for Cyp6p4 (a) and Cyp6aa1 (b), comparing individuals homozygous for the swept triple mutant haplotype and heterozygotes in the BusiaUG colony to wild‐type individuals. 95% confidence intervals are shown. Asterisks indicate statistical significance in two‐tailed students t‐tests; ***p ≤ .001, **p ≤ .01, **p ≤ .05
