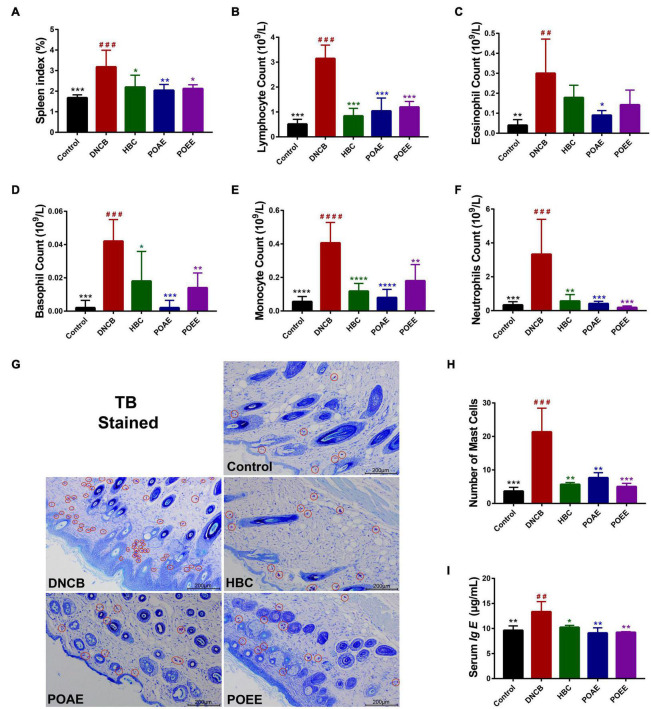
FIGURE 4.
POAE and POEE reduced the number of immune cells and abnormal increase in serum Ig E in AD mice. (A) Spleen indices of mice in each group (n = 5 per group). (B–F) The number of lymphocytes, eosinophils, basophils, monocytes and neutrophils in each group of mice (n = 5 per group). (G) Pictures of representative dorsal skin TB staining of each group. Red circles mark some of the mast cells (Scale bar: 200 μm). (H) The number of mast cells in the dermis of each group (n = 3 per group). (I) Serum Ig E concentration of mice in each group (n = 3 per group). The data were expressed as mean ± SD. ##P < 0.01, ###P < 0.001, ####P < 0.0001, vs. control groups; *P < 0.05, **P < 0.01, ***P < 0.001, ****P < 0.0001, vs. model (DNCB) groups.

