FIGURE. 1.
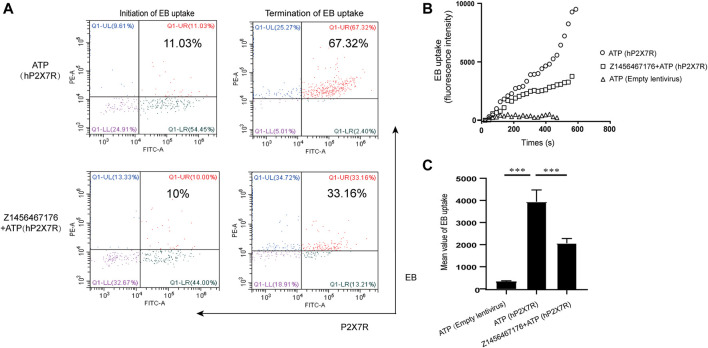
Z1456467176 inhibits ATP-induced P2X7R pore formation. (A) Representative flow diagram of EB uptake by HEK-293T cells overexpressing hP2X7R in response to ATP. The red Q1-UR region reflects double-positive staining for EB and hP2X7R. FACS analysis of the intracellular fluorescence intensity (B) and mean value analysis of quantified intracellular fluorescence intensity (C). Data are presented as the means ± S.E.M.s. Statistics were analyzed using Dunnett’s t-test. ***p < 0.001.

