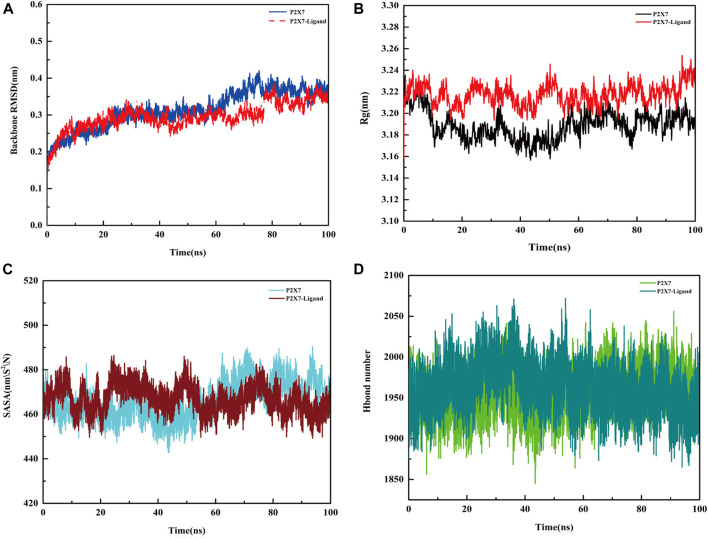
FIGURE. 8.
Molecular dynamics simulation of the P2X7R protein and protein‒ligand. (A) Variation in RMSD values of the protein (P2X7R, blue line) and protein‒ligand (Z1456467176, red line) systems with time. (B) Rg values of the protein (black line) and protein‒ligand (red line) systems with time. (C) SASA area of the protein (blue line) and protein‒ligand (red line) systems over time. (D) The hydrogen bond formed between the protein (light green line), protein‒ligand (dark green line) system and water.

