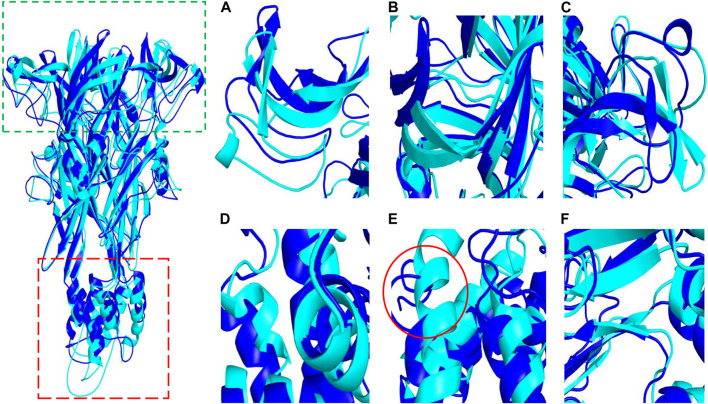
FIGURE. 9.
The conformational difference between P2X7R and P2X7R-ligand. The diagram on the left shows conformational differences between the pure protein (P2X7R, blue) and the protein‒ligand (Z1456467176, cyan). The green and red boxes indicate the approximate locations of the domains shown in (A–C) and (D–F), respectively. (A–C) The conformation of the open region at the upper end of P2X7R. (D–F) The conformation of the helical region of P2X7R.

